Figures & data
Figure 1 Erythropoiesis and the expression of stage-specific markers.
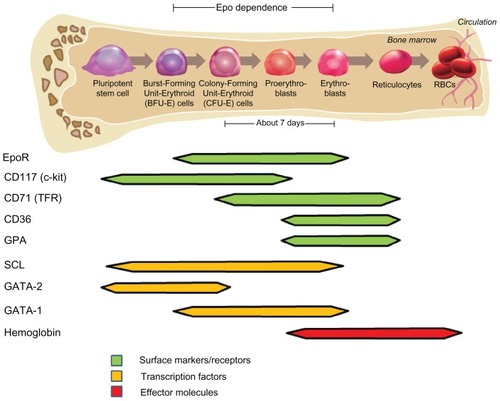
Figure 2 (A and B) Erythropoietin (Epo) mRNA is expressed in kidney interstitial cells. Mice were made anemic by withdrawing 0.5 mL blood and replacing with 0.5 mL saline 8, 16, and 24 hours prior to sacrifice. Standard in situ hybridization (ISH) on kidney sections was performed with an antisense 33P-labeled Epo probe. (A) ISH for mouse Epo mRNA in a control mouse; (B) ISH for mouse Epo mRNA in an anemic mouse.
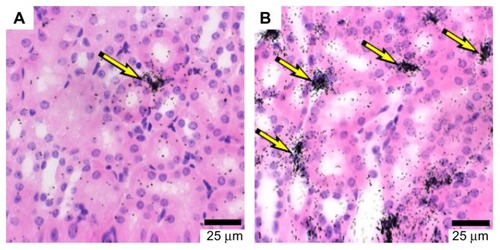
Figure 3 Erythropoietin receptor (EPOR), GATA-1, and SCL/Tal1 have similar transcript profiles in normal human tissue.
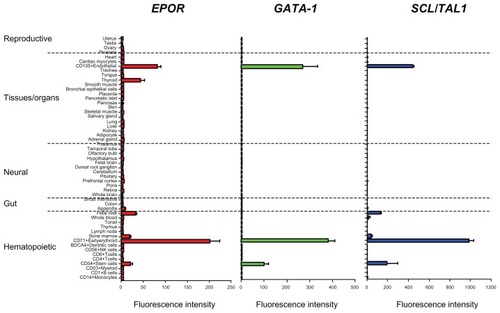
Figure 4 High-level erythropoietin receptor (EpoR) protein expression is found in erythroid cells but not in other tissues. EpoR expression was analyzed by Western immunoblot analysis with anti-EpoR antibody A82 that was shown to specifically detect human EpoR in erythroid cells.Citation78 The arrow shows the location of full-length EpoR. Smaller proteins have been shown elsewhere to be EpoR fragments.Citation78 UT-7/ Epo cells (EpoR positive control) are derived from a megakaryoblastic leukemia and are Epo-dependent.Citation462
Abbreviations: HUVEC, human umbilical vein endothelial cells; RPTEC, renal proximal tubule epithelial cells.
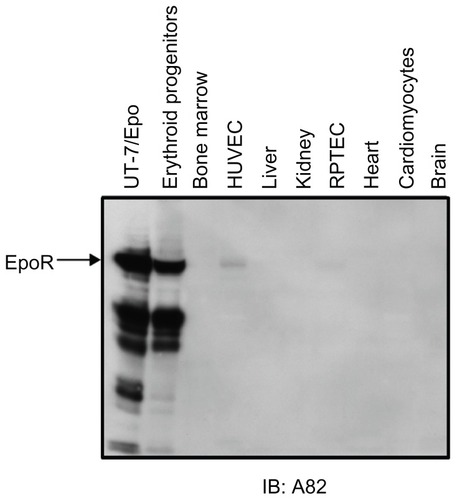
Figure 5 Erythropoietin receptor (EpoR) expression in differentiating CD34+ hematopoietic progenitor cells grown with or without Epo.
Abbreviation: MWM, molecular weight marker in kilo Daltons (kDa).
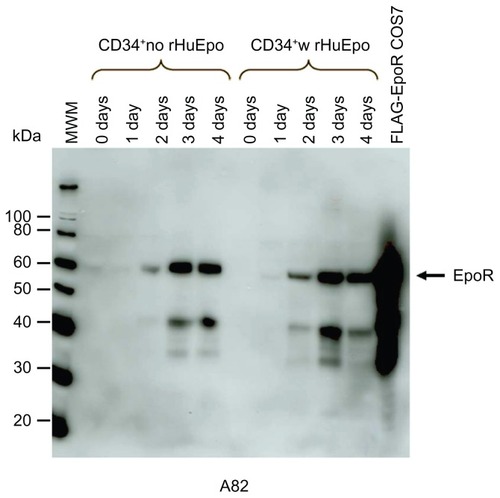
Figure 6 Erythropoietin receptor (EpoR) activation and signaling with Epo in erythroid progenitor cells.
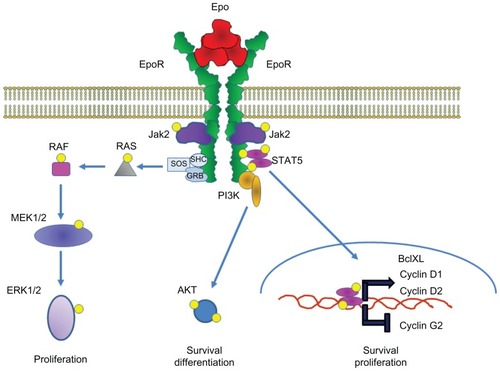
Table 1 Effect of erythropoiesis-stimulating agents in xenograft or syngenic tumor models