Figures & data
Figure 1 Chronology of observations from studies of rAHF-PFM leading toward personalized care for patients with hemophilia A.
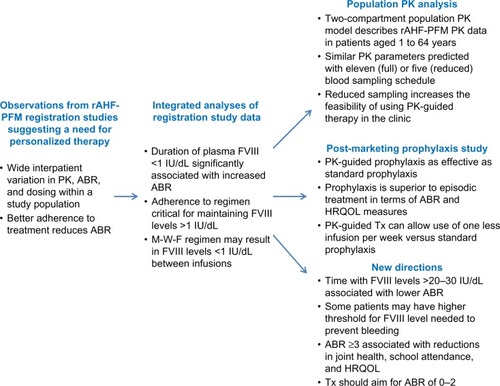
Table 1 Summary of clinical registration studies of rAHF-PFM
Table 2 Efficacy ratings for treatment of bleeding in studies of rAHF-PFM
Figure 2 Predicted annual joint bleed rate as a function of time spent with factor (F)VIII <1 IU/dL. Negative binomial linear model with joint bleed rate as the dependent variable, and time with FVIII <1 IU/dL, age, and body weight as independent variables. The figure shows the predicted probability of having no bleeds per year dependent on time per week spent with an FVIII <1 IU/dL.
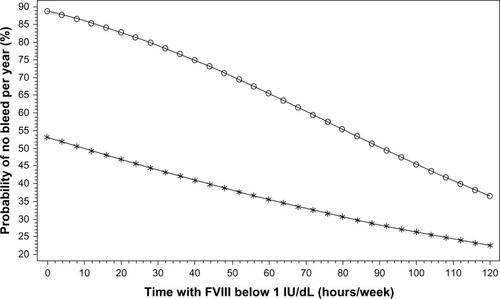
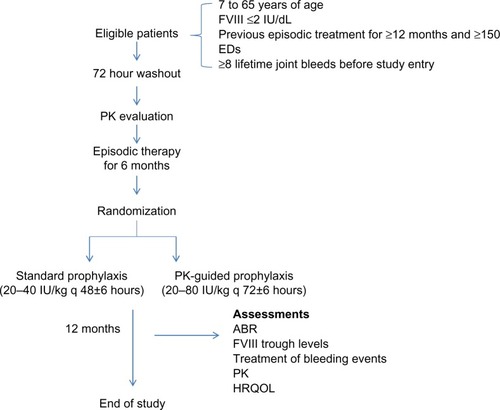
Figure 3 Study design for comparison of standard prophylaxis, PK-guided prophylaxis, and episodic treatment with rAHF-PFM.