Figures & data
Table 1 Characteristics of patients at baseline
Figure 1 Scatter plot of specific IgG4 antibodies versus DAS28.
Abbreviation: DAS, Disease Activity Score.
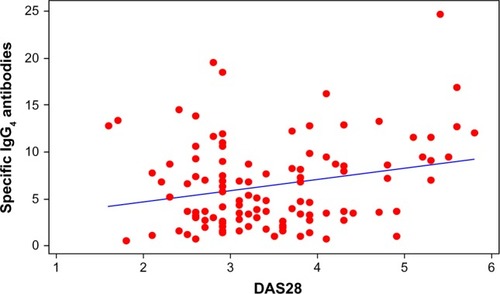
Figure 2 IgG4 specific antibodies against three different TNF blocking agents and DAS28.
Abbreviation: DAS, Disease Activity Score.
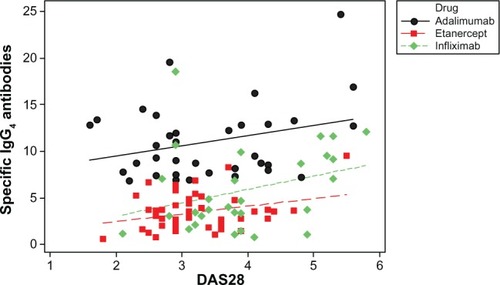
Figure 3 Correlation between IgG4 specific antibodies, adverse effects and DAS28.
Abbreviations: DAS, Disease Activity Score; RA, rheumatoid arthrirtis.
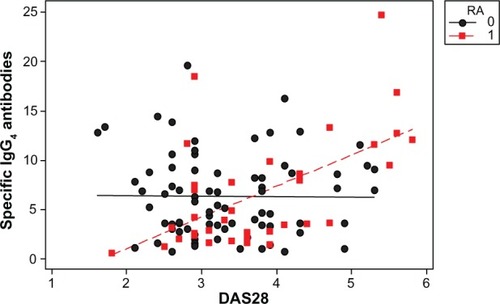
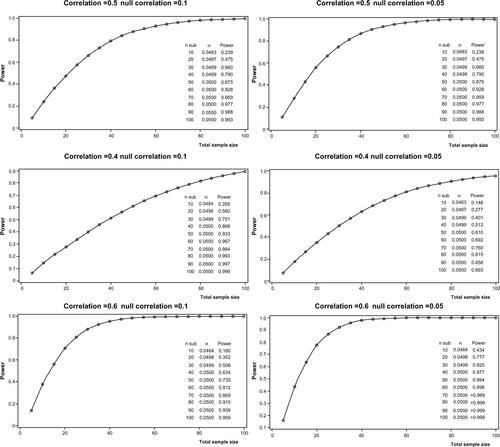
Figure S1 Power calculations.
Notes: Power calculation reporting power (1-beta) vs sample size (number of pairs) under the assumption of a correlation coefficient ranging from 0.4 to 0.6 (moderate weak to moderate strong) with a null correlation of 0.1 and 0.05 for the left and the right panels respectively.