Figures & data
Table 1 Study inclusion and exclusion criteria
Table 2 Summary of subject disposition during the study period
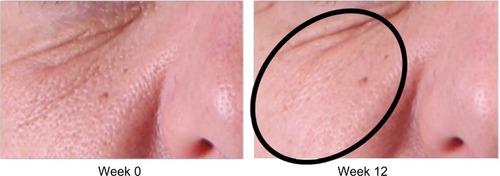
Figure 1 Improvement of crow’s feet and decrease in fine rhytides in the identified regions.
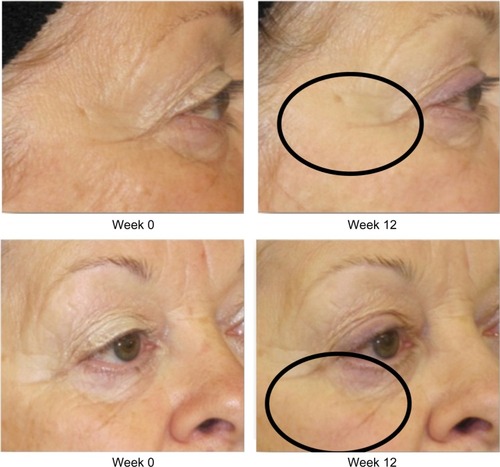
Figure 2 Improvement of crow’s feet and decrease in fine rhytides in the identified lower lid region.
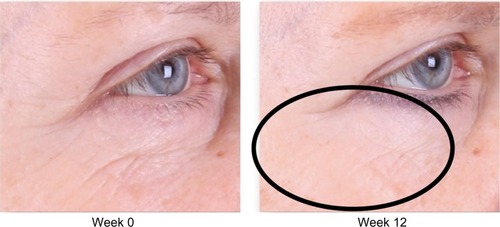
Figure 3 Improvement of crow’s feet and decrease in fine rhytides in the identified regions.
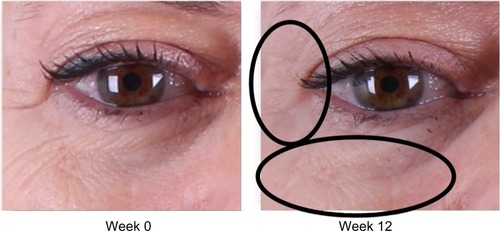
Figure 4 Glabella improvement at week 12 (anterior view) in the identified region.
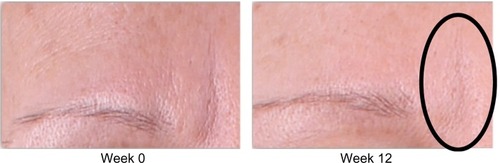
Table 3 Physicians’ assessment results
Figure 5 Graphical representation of TWS placebo least-square mean adjusted predicted value change.
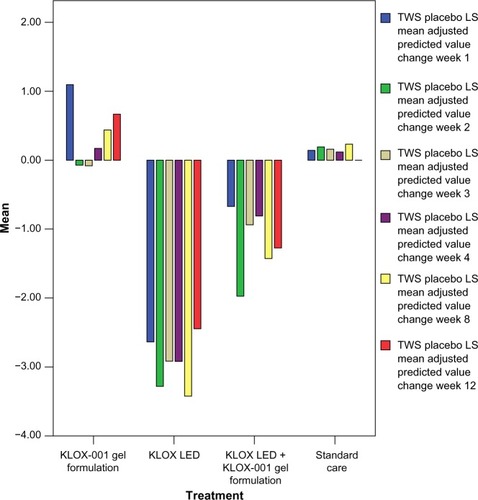
Figure 6 TWS placebo least-square mean adjusted predicted value change.
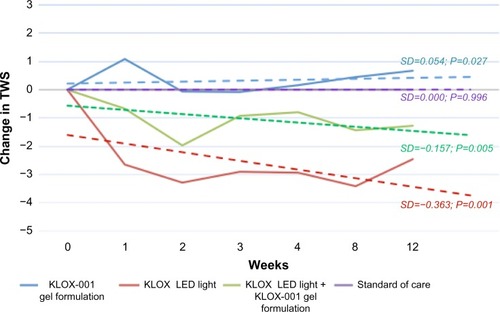
Figure 7 Gomori staining of retroauricular biopsy samples: (A) week 0; (B) week 12.
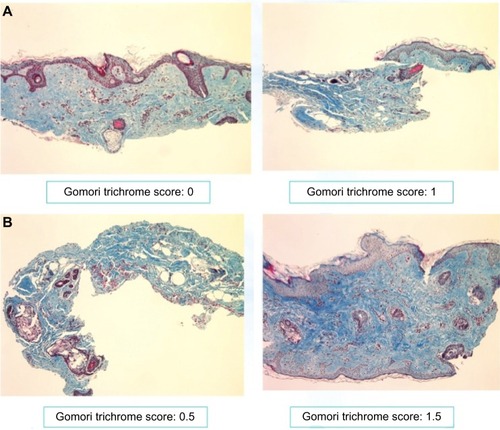
Table 4 Skin biopsy results (collagen in Gomori Trichrome staining)
Table 5 Summary of treatment-related adverse events
Figure 8 Pore size improvement at week 12.