Figures & data
Figure 1 HBD2 gene expression in normal human epidermal keratinocytes after 72-hour treatment with 0.00002% sphinganine measured by qRT-PCR.
Notes: Results are shown as fold induction compared to vehicle (0.1% DMSO) treatment. *P<0.05 versus vehicle.
Abbreviations: qRT-PCR, quantitative real-time polymerase chain reaction; DMSO, dimethyl sulfoxide.
Abbreviations: qRT-PCR, quantitative real-time polymerase chain reaction; DMSO, dimethyl sulfoxide.
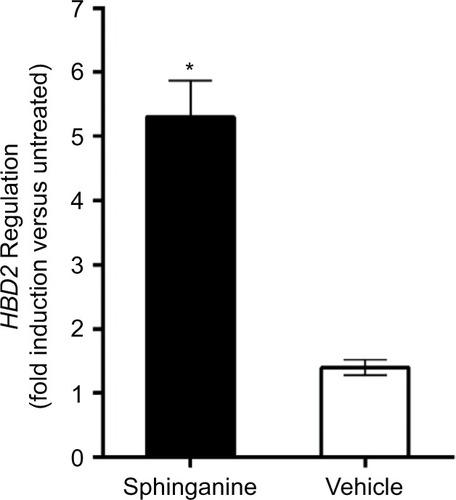
Figure 2 HBD2 protein expression in human living skin explants.
Notes: Either the vehicle (left) or a test solution containing 0.1% sphinganine (right) was repeatedly applied during an overall cultivation period of 7 days. Following histological processing and immunostaining with an anti-HBD2 antibody, HBD2 protein (green color) was visualized by fluorescence microscopy. Nuclei (red color) were stained with propidium iodide.
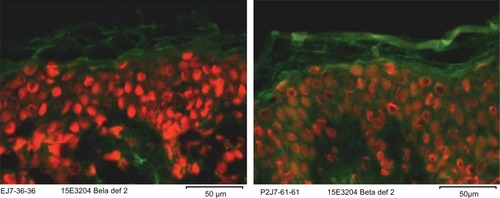
Figure 3 Effect of sphinganine on hair loss in males and females.
Notes: Box plot graphic illustrating the difference (pre–post) of anagen rate after 8 and 16 weeks of treatment compared to baseline in females (A) and males (B). Median, upper, and lower quartile and whiskers are illustrated. Statistical differences in the anagen rate between baseline and after 8 and 16 weeks of treatment as well as statistical differences in the anagen rate between verum groups and placebo group are indicated by asterisks: *P<0.05 and **P<0.01 pre–post (Wilcoxon signed-rank test). Normalized anagen rates after 8 and 16 weeks of treatment are shown for males and females (C).
Abbreviation: w, week.
Abbreviation: w, week.
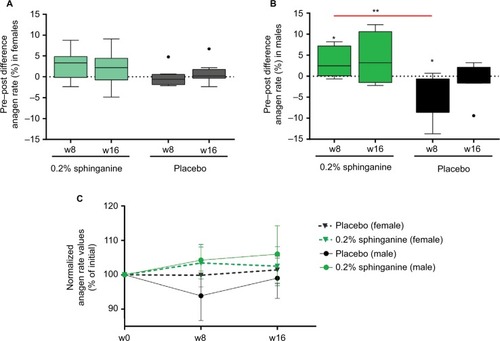
Figure 4 Dose-dependent effect of sphinganine in male.
Note: Box plot graphic illustrating the difference (pre–post) of anagen rate after 8 and 16 weeks of different treatments with different concentrations of sphinganine compared to baseline in males (A). Statistical differences in the anagen rate between baseline and after 8 and 16 weeks of treatment as well as statistical differences in the anagen rate between verum groups and placebo group are indicated by asterisks: *P<0.05 pre-post (Wilcoxon signed-rank test). Normalized anagen rates after 8 and 16 weeks are shown (B). Representative photographs of hair loss improvement of four test subjects taken before (left) and after 16 weeks (right) of application of verum hair tonic are shown (C).
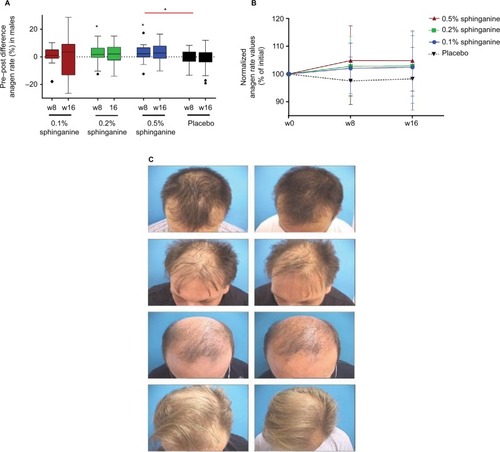
Table 1 Test subjects’ characteristics at inclusion and descriptive statistics of anagen hair rates, in percentage, of dose-dependent efficacy study
Table 2 Anagen hair rates, in percentage, for each individual test subject of dose-dependent efficacy study
Figure 5 12-Month extension study with three selected “high-responder” test subjects.
Note: Shown are normalized anagen rates after 2, 4, 6, 9, and 12 months of application of hair tonic with different sphinganine concentrations.
Abbreviation: m, month.
Abbreviation: m, month.
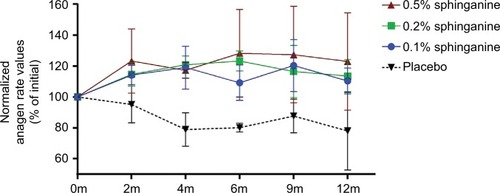
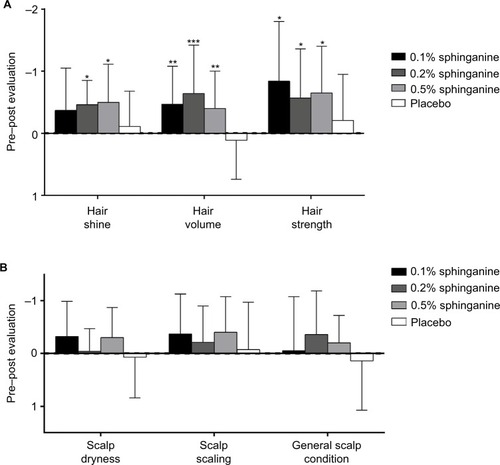
Figure 6 Expert evaluation on hair quality (A) and scalp health (B).
Notes: Mean differences in pre- and post-evaluation scores comparing data from baseline and after 16 weeks are illustrated. Statistical significance in the pre–post difference of the sphinganine groups versus placebo is indicated (Wilcoxon rank sum test: *P<0.05, **P<0.01, and ***P<0.001).