Figures & data
Table 1 Materials and instruments employed in the study
Figure 1 Reduction in the surface microrelief throughout the study.
Note: *P<0.05 vs T0.
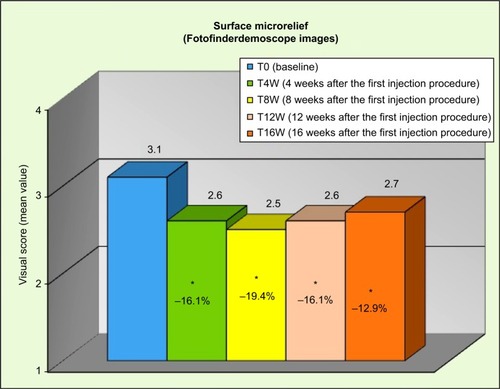
Figure 2 Reduction in the FVLS “cheek volume loss” throughout the study.
Note: *P<0.05 vs T0.
Abbreviation: FVLS, facial volume loss scale.
Abbreviation: FVLS, facial volume loss scale.
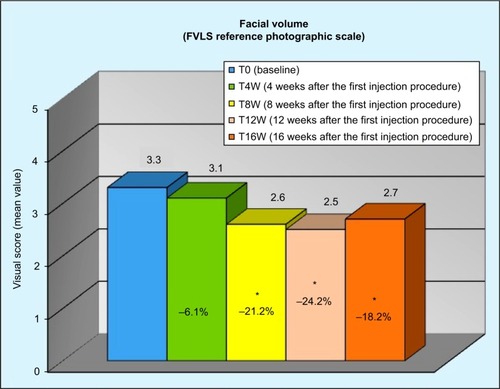
Figure 3 Reduction in the WSRS “wrinkle severity” throughout the study.
Note: *P<0.05 vs T0.
Abbreviation: WSRS, wrinkle severity rating scale.
Abbreviation: WSRS, wrinkle severity rating scale.
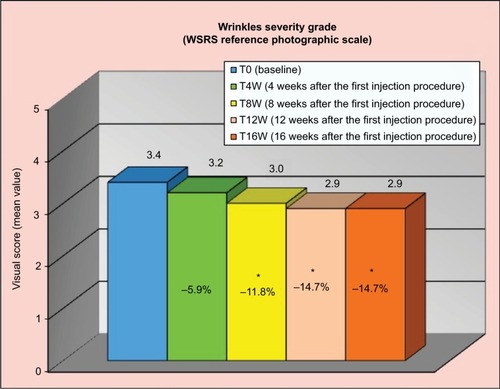
Figure 4 Variation from baseline in the skin electrical capacitance.
Note: *P<0.05 vs T0.
Abbreviation: AU, arbitrary unit.
Abbreviation: AU, arbitrary unit.
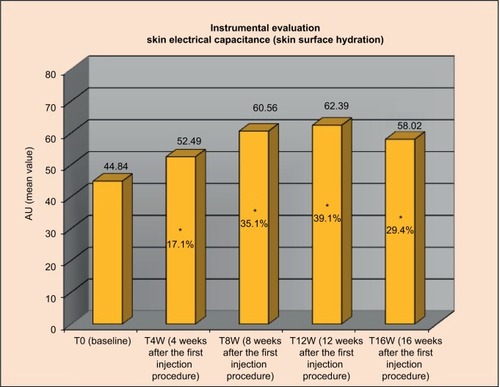
Figure 5 Three-dimensional face volume analysis: increase of volume (cm3) T0 versus T8W and T16W versus T0.
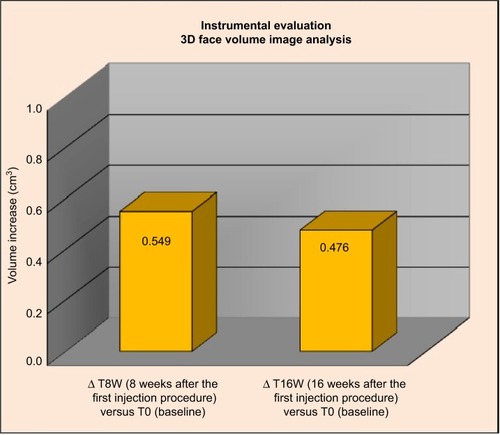
Figure 6 Stacked bar plots of self-assessed efficacy by volunteers at week 16.
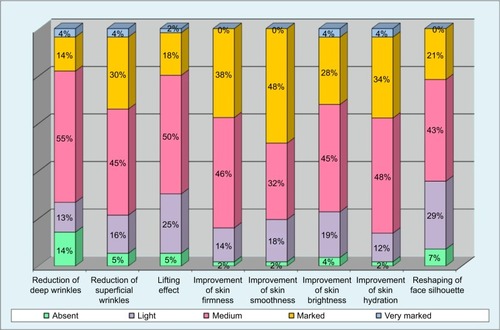
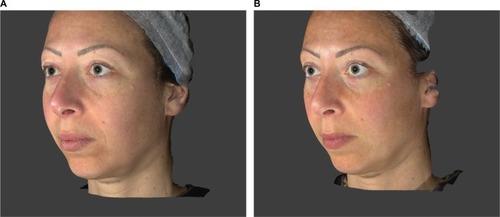
Figure 7 Subject 11 (49 years old): (A) T0 Baseline and (B) T8W 8 weeks after the first injection procedure.
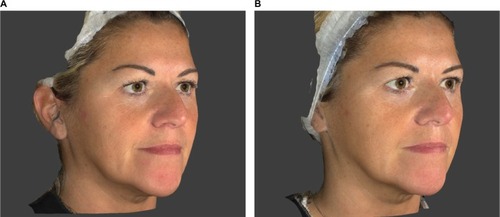
Figure 8 Subject 19 (39 years old): (A) T0 Baseline and (B) T8W 8 weeks after the first injection procedure.