Figures & data
Figure 1 Swab and scrub wash sampling techniques.
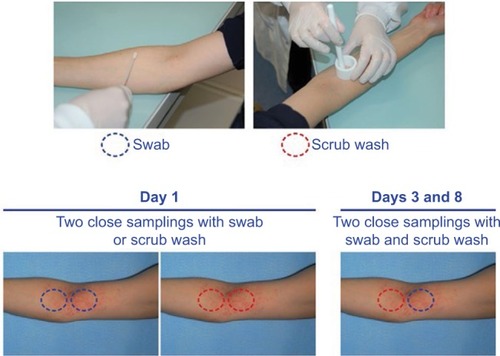
Table 1 Baseline demographics and disease characteristics
Table 2 Presence and concentration of Staphylococcus aureus on the target lesion at baseline (Population 1)
Figure 2 Repeatability (first and second sampling) of Staphylococcuss aureus sampling (A) and quantification (B) methods at Day 1 for load determination (Log10 CFU/cm2) in target atopic dermatitis lesions.
Abbreviations: CFU, colony forming units; PCR, polymerase chain reaction.
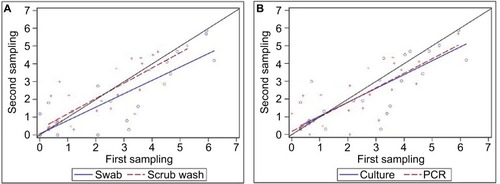
Figure 3 Staphylococcus aureus load evolution between Days 8 and 28 in target atopic dermatitis lesions treated with heat-treated Lactobacillus johnsonii lotion vs contralateral lesions untreated or treated with patient’s usual moisturizer (n=15).
Abbreviations: CFU, colony forming units; PCR, polymerase chain reaction.
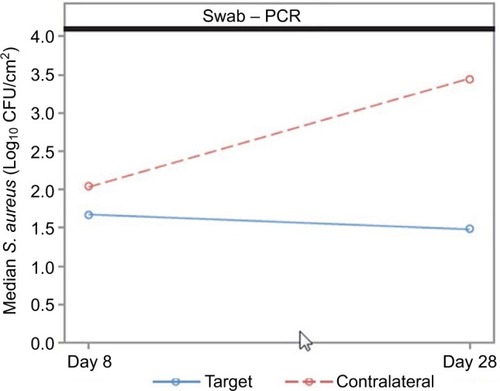
Figure 4 Change in skin microbiota composition between Days 8 and 28 in target atopic dermatitis lesions treated with heat-treated Lactobacillus johnsonii lotion.
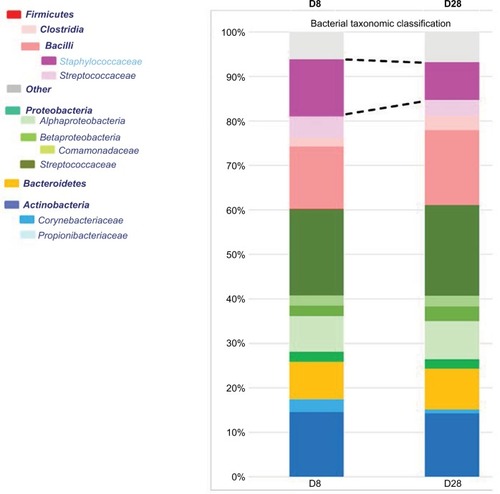
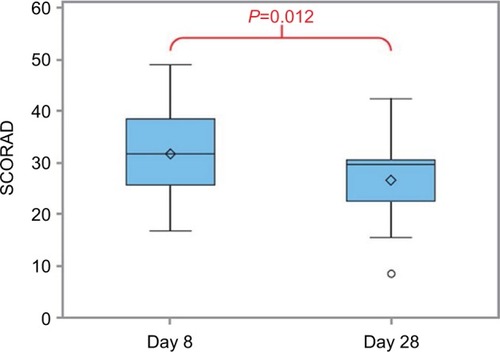
Figure 5 Box plots show local objective SCORAD evolution between Days 8 and 28 in target atopic dermatitis lesions treated with heat-treated Lactobacillus johnsonii lotion. Statistical analysis was performed using the paired t-test.
Abbreviation: SCORAD, SCORing Atopic Dermatitis.