Figures & data
Figure 1 L-histidine increases filaggrin protein formation in confluent human (HaCaT) keratinocyte monolayers. (A) Representative Western blots showing a decrease in 120 kDa filaggrin and an increase in 37 kDa filaggrin formation after treatment with L-histidine. (B) L-lysine and D-histidine had no significant effect on filaggrin protein expression while L-histidine increased the 37 kDa to 120 kDa filaggrin ratio (P<0.01), as compared to controls. (C) L-histidine increased the 37 kDa:120 kDa filaggrin ratio in a dose-dependent manner (R2=0.54, P<0.01). Error bars represent mean ± SD, where n=6. All bands were standardized to housekeeping protein keratin 10 loading control. **p<0.01.
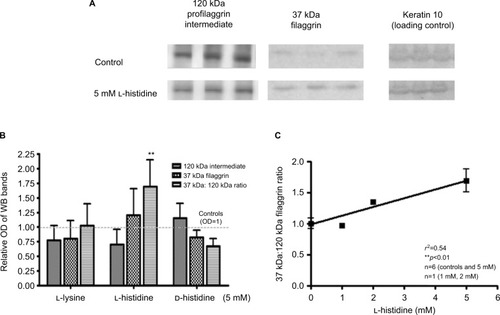
Figure 2 L-histidine enhances the barrier function of organotypic skin model as indicated by penetration of Lucifer Yellow fluorescent dye. (A) A representative image of organotypic skin model with Lucifer Yellow dye seen under fluorescence and H&E staining. (B) Skin models grown in 5 mM L-histidine had reduced dye penetration (N=5; P<0.01), whereas L-lysine and L-serine had no effect on barrier function.
Abbreviation: H&E, hematoxylin and eosin.
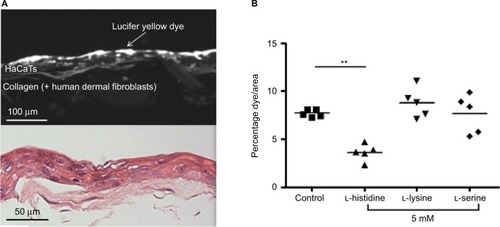
Figure 3 Clinical study protocol and patient details. (A) Schema showing the study protocol, (B) patients completed POEM questionnaires weekly, and (C) disposition of patients. There was a good correlation between SCORAD and POEM scores (R2=0.62) in study patients in Group A (■) (n=11) and Group B (□) (n=10) at week 0. There was no difference in mean SCORAD or POEM scores between the two groups (P=0.86).
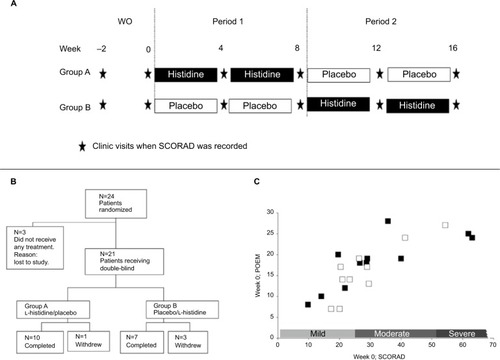
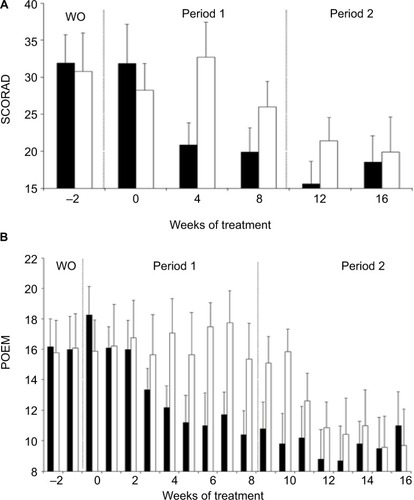
Figure 4 Effects of L-histidine nutritional supplementation on AD disease severity. (A) SCORAD and (B) POEM scores (mean ± SEM) were significantly reduced in Group A (■) patients at weeks 4 and 8 (SCORAD, P=0.0029 and P=0.0029; POEM, P=0.0020 and P=0.0010, respectively) in period 1, whilst the placebo had no effect in Group B (□) patients in period 1 (SCORAD, P=0.3223 and P=0.5391; POEM, P=0.8438 and P=0.2695, respectively). There is a clear “carry-over”effect of L-histidine in Group A between weeks 8 and 12, which precludes meaningful statistical analysis within the study period 2.