Figures & data
Figure 1 HTS screening of compounds with MMP1 inhibitory activity.
Abbreviations: DGA, dihydrogambogic acid; HTS, high-throughput screening; MMP1, matrix metalloproteinase-1.
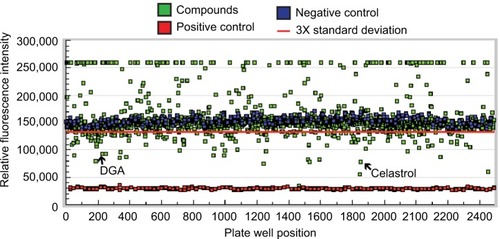
Figure 2 DGA inhibits cleavage of COL1 fibrils by MMP1.
Notes: (A,B) MMP1 was preincubated with vehicle or DGA for 30 minutes and then added to native COL1. After 16 hours, COL1 was dissolved in Laemmi loading buffer. Intact COL1 and COL1 fragments were separated by SDS-PAGE and visualized by Coomassie blue staining. MMP1 cleaved COL1 and yielded characteristic fragments with size of “1/4” or “3/4” that of intact collagen. Collagen fragments were quantified using ImageQuant software. Results are mean ± SEM (N = 3; **p<0.01). (A) shows a representative gel.
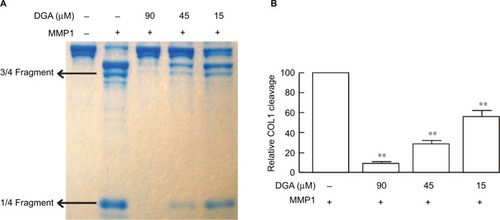
Figure S1 Kinetics and peptide substrate concentration dependence of cleavage by MMP1-CD.
Notes: To optimize assay conditions for HTS, we examined both the MMP1-CD concentration dependence and the fluorogenic peptide substrate concentration dependence on the kinetics of peptide substrate cleavage by MMP1-CD. This figure shows the peptide substrate concentration dependence of cleavage by 0.2 ng/mL MMP1-CD. MMP1-CD was incubated with peptide substrate at the indicated concentrations for 4 hours at room temperature. Relative fluorescence intensity was monitored at the indicated times. Each point represents the mean of three independent experiments.
Abbreviations: HTS, high-throughput screening; MMP1-CD, matrix metalloproteinase-1-catalytic domain.
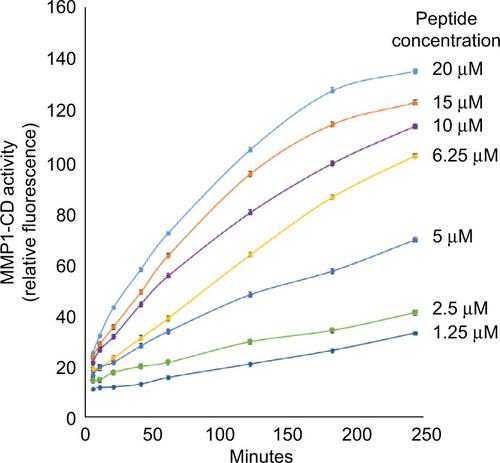
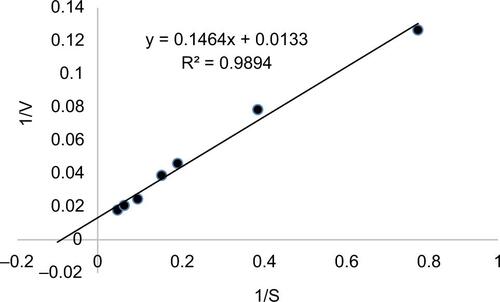
Figure S2 Determination of Km using the Lineweaver–Burk double reciprocal plot.
Notes: The Km was 11 μm.