
Figures & data
Figure 1 Resazurin levels, indicating cell viability, in ex vivo photoaging and photo-oxidation study.
Abbreviations: IC, irradiated control; IST, irradiated and serum treated; NIC, nonirradiated control; RES, resazurin.
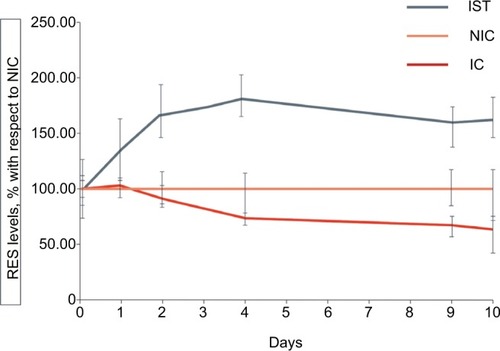
Table 1 Ex vivo study, antioxidant, and antiphotoaging parameters
Figure 2 Antiphotoaging study, mean collagen, and elastin levels at the end of the study (day 10).
Abbreviations: IC, irradiated control; IST, irradiated and serum treated; NIC, nonirradiated control.
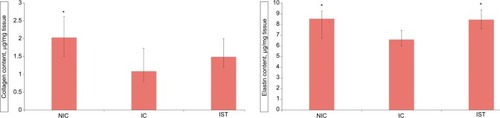
Figure 3 Masson–Goldner staining of dermal tissue in the ex vivo photoaging study, with connective fibers stained blue-green, fibroblast nuclei stained dark brown-black, and fibroblast cytoplasm stained light red-pink (magnification 200×).
Notes: (A) Untreated control tissue; (B) irradiated control tissue; and (C) irradiated and serum-treated tissue.
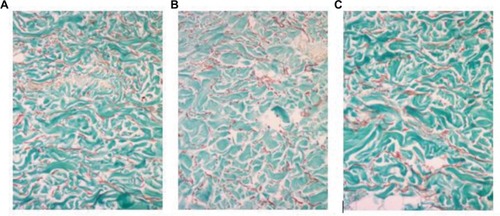
Table 2 P-values from statistical analysis in photoaging and photo-oxidation study: unpaired t-test comparisons between experimental groups
Figure 4 Markers of oxidation in the antioxidant and antiphotoaging study.
Abbreviations: CPDs, cyclobutane pyrimidine dimers; IC, irradiated control; IST, irradiated and serum treated; NIC, nonirradiated control; ROS, reactive oxygen species.
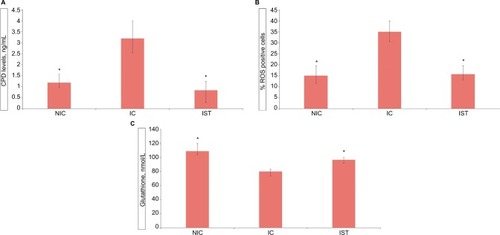
Table 3 P-values from statistical analysis in photoaging and photo-oxidation study: unpaired t-test comparisons between experimental groups
Figure 5 Resazurin levels, indicating cell viability, throughout the hydrocortisone aging study.
Abbreviations: HC, hydrocortisone control; HST, hydrocortisone and serum treated; NHC, non-HC; RES, resazurin.
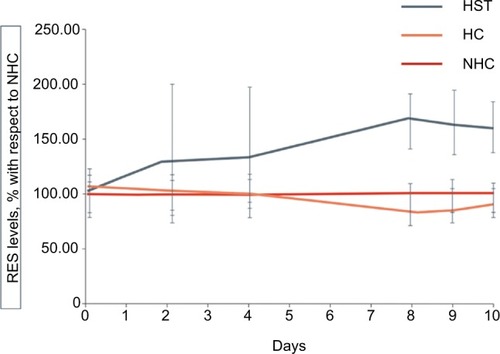
Figure 6 Masson–Goldner staining of dermal tissue in the ex vivo hydrocortisone study, with connective fibers stained blue-green, fibroblast nuclei stained dark brown-black, and fibroblast cytoplasm stained light red-pink (magnification 200×).
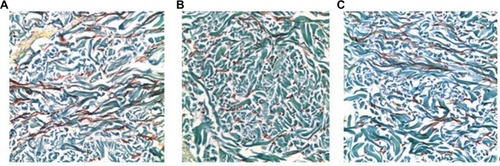
Table 4 Outcome variables for antiaging efficacy in the hydrocortisone ex vivo study
Figure 7 Alcian blue-stained dermal tissue from ex vivo hydrocortisone study.
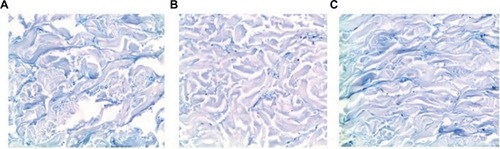
Table 5 Clinical studies subject characteristics
Figure 8 Hydration kinetics study of skin moisture levels over time as measured with corneometer.
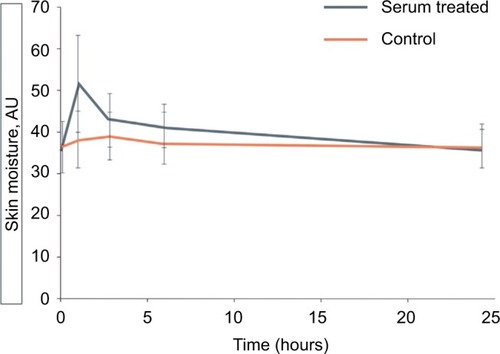
Figure 9 Hydration kinetics study of skin moisture levels over time as measured with Skicon hygrometer.
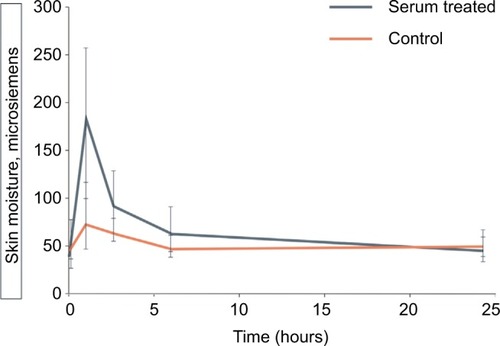
Table 6 Results from subjective efficacy questionnaire under dermatological control and consumer test questionnaire