Figures & data
Figure 1 Evolution of glucose serum levels at baseline and during 1 and 3 months of FOS/GOS dietary supplementation (P=0.022; ANOVA).
Abbreviations: ANOVA, analysis of variance; FOS/GOS, fructo-oligosaccharides/galacto-oligosaccharides.
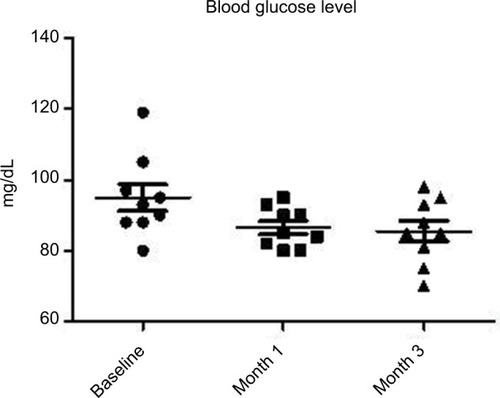
Figure 2 Evolution of total cholesterol serum levels at baseline and during FOS/GOS dietary supplementation from baseline and after 1 and 3 months (P=0.018; ANOVA).
Abbreviations: ANOVA, analysis of variance FOS/GOS, fructo-oligosaccharides/galacto-oligosaccharides.
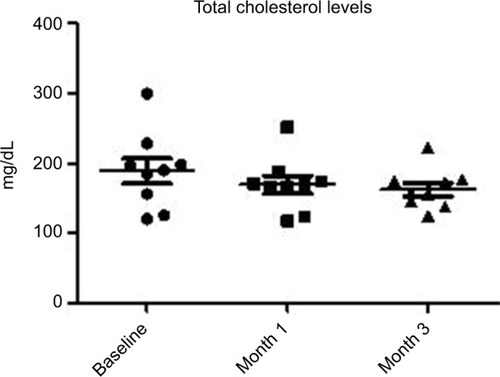
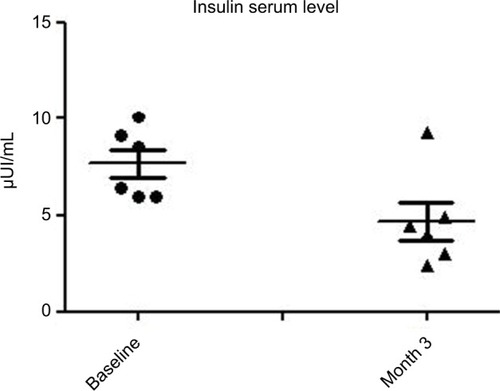
Figure 3 Evolution of insulin serum level (subset of subjects with baseline insulin levels >6 µUI/mL) (P=0.03; paired t-test).