Figures & data
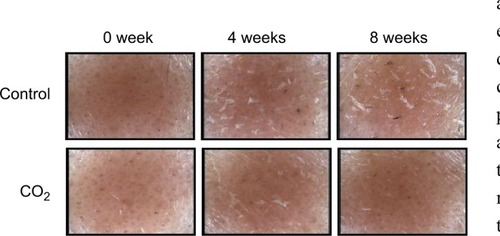
Figure 1 Changes in epidermal function with CO2 application.
Notes: Each parameter is shown as the amount of change (Δ) from 0 week to 4 or 8 weeks for TEWL (A) and conductance (B). Values are mean±SE (n=19). #P<0.05, ##P<0.01 vs 0 week by Dunnett’s test. *P<0.05 vs control at 8 weeks via paired t-test. Difference in ΔConductance between the two conditions was statistically significant via two-way repeated measures ANOVA.
Abbreviation: TEWL, transepidermal water loss.
Abbreviation: TEWL, transepidermal water loss.
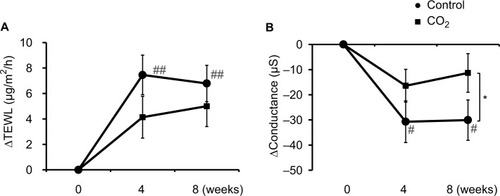
Table 1 Parameters of epidermal function at each time point
Figure 2 Changes in skin surface profile with CO2 application.
Notes: Each parameter is shown as the amount of change (Δ) from 0 week to 4 or 8 weeks for SESC. Values are mean±SE (n=19). #P<0.05, ##P<0.01 vs 0 week by Dunnett’s test. *P<0.05 vs control at 8 weeks via paired t-test. Difference in ΔSESC between two conditions was statistically significant via two-way repeated measures ANOVA.
Abbreviation: SESC, skin scaliness.
Abbreviation: SESC, skin scaliness.
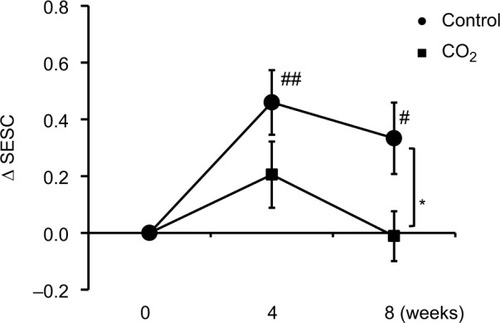
Table 2 Parameters of the skin surface profile and property at each time point
Figure 3 Changes in skin surface appearance.
Notes: Microscopic skin surface images from 0, 4, and 8 weeks obtained with the dry skin microscope are shown. The magnification rate was 30 times. The length of the long side was 6 mm.