
Figures & data
Table 1 Demographic and baseline characteristics
Table 2 Treatment characteristics (safety population)
Figure 1 WSRS improvement rates assessed by the Independent Review Committee at 24 weeks.
Abbreviations: FAS, full analysis set; PP, per-protocol; PV, Princess® VOLUME; RL, Restylane®; WSRS, Wrinkle Severity Rating Scale.
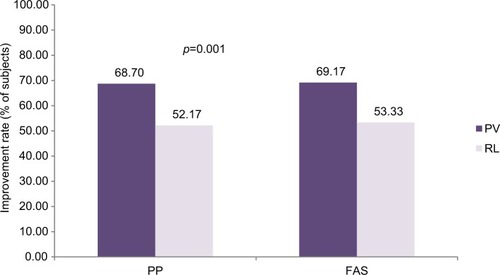
Figure 2 GAIS score assessed by the Independent Review Committee over time for the FAS population.
Abbreviations: FAS, full analysis set; GAIS, Global Aesthetic Improvement Scale; PV, Princess® VOLUME; RL, Restylane®.
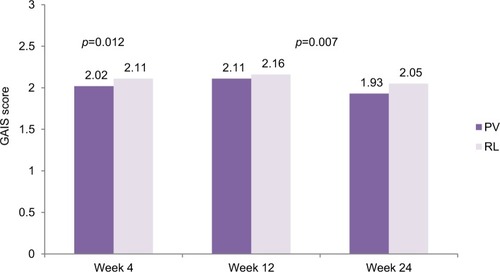
Figure 3 GAIS score assessed by the subjects over time for the FAS population.
Abbreviations: FAS, full analysis set; GAIS, Global Aesthetic Improvement Scale; PV, Princess® VOLUME; RL, Restylane®.
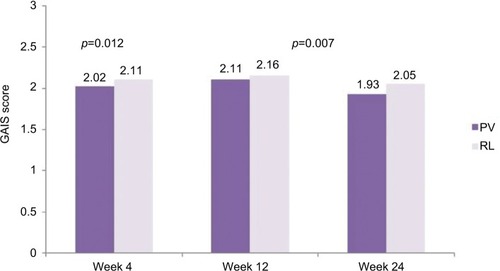
Table 3 Incidence of treatment site AEs