
Figures & data
Figure 1 Evolution of transepidermal water loss (TEWL). *P=0.002; Wilcoxon test.
Abbreviations: TEWL, Trans Epidermal Water Loss; D0, Day zero; D28, Day 28.
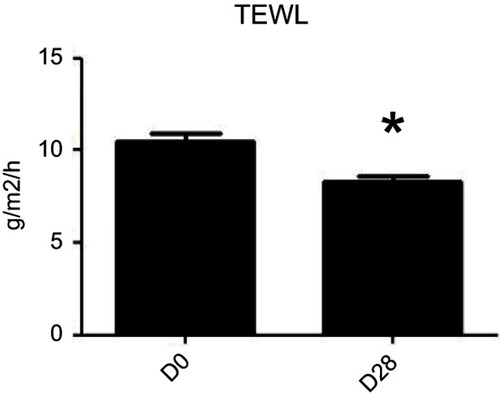
Figure 2 Evolution of dark spots evaluated with colorimetry; *P=0.0021; Wilcoxon test. Abbreviation: ITA, Individual Typology Angle.
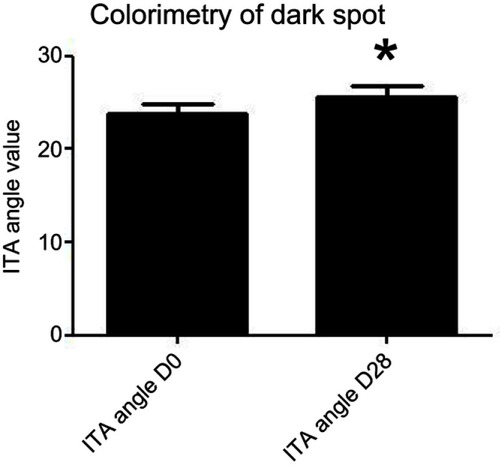
Figure 3 Evolution of SQOOH/SQ ratio. *P=0.017; Wilcoxon test.
Abbreviations: SQOOH, Squalene peroxide; SQ, Squalene.
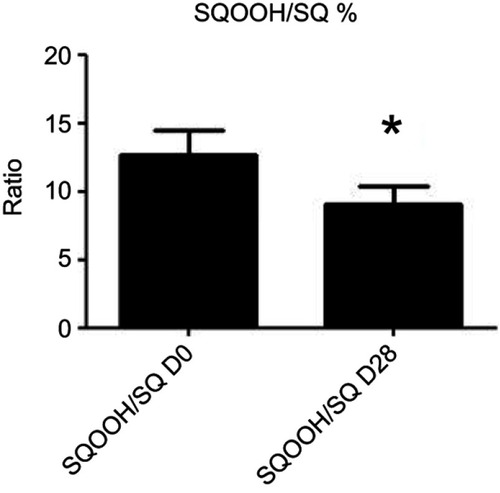
Figure 4 High-resolution pictures of two subjects evaluating dark spots (A and A1: baseline, D0; B and B1: after treatment D28).
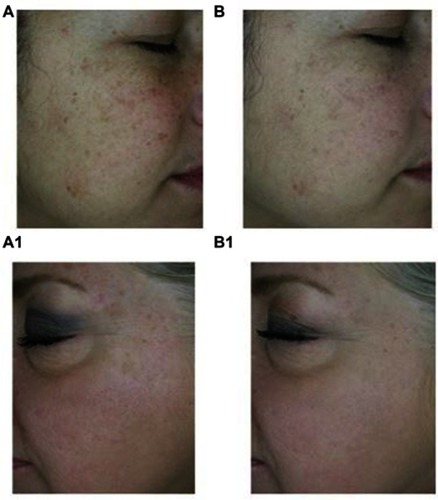
Table 1 Subjects’ characteristics at baseline
Table 2 Data analysis of outcomes variables