
Figures & data
Figure 1 Treatment area and injection points for the left lower cheek. An identical injection pattern was used on the opposite cheek.
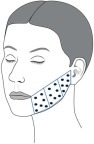
Figure 2 Overview of subject demographics and disposition.
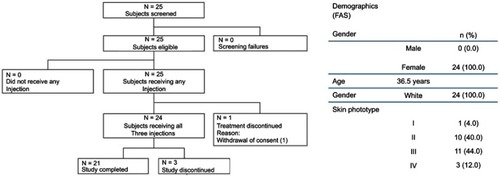
Figure 3 Viscoelastic skin properties of the entire face (A) gross elasticity (R2; mean ± SD) measured before (day 0/baseline) and after three consecutive treatments with CPM®-HA20G at day 0, week 4, and week 8 and all upcoming visits until week 28. (B) Skin fatigue (R9; mean ± SD) measured before (day 0/baseline) and after three consecutive treatments with CPM®-HA20G at day 0, week 4, and week 8 and all upcoming visits until week 28. Due to a technical malfunction of the cutometer device, no test values could be obtained at week 36 visit. *p<0.05, **p<0.01, and ***p<0.001.
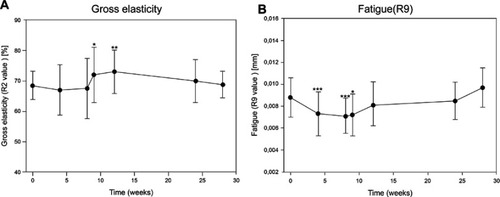
Table 1 Summary of cutometer values for the assessment of skin firmness (R0 values)
Figure 4 Skin hydration values of the entire face (A) Overall skin hydration values (mean ± SD) measured before (day 0/baseline) and after three consecutive treatments with CPM®-HA20G at day 0, week 4, and week 8 and all upcoming visits until week 36. (B) Change of skin hydration values (mean ± SEM) from week 4 to week 36 visit. *p<0.05 and ***p<0.001.
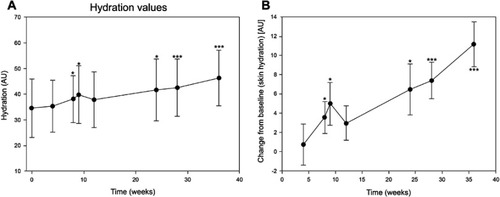
Table 2 Subjects (n[%]) reporting satisfaction with various changes in skin texture over the study interval
Figure 5 Skin radiation and skin roughness values of the entire face. (A) Change of skin radiation values (hemoglobin and melanin, each mean ± SEM) from week 4 to week 36 visit. (B) Change of skin roughness values (Ra, Rq, and Rz, each mean ± SEM) from week 4 to week 36 visit. *p<0.05, **p<0.01, and ***p<0.001.
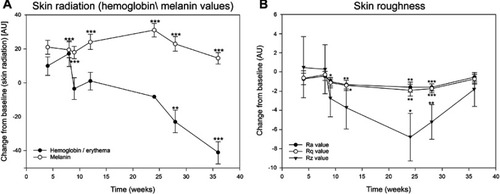
Figure 6 Investigators Global Aesthetic Improvement Scale (GAIS) ratings. Improved = summary of ratings for improved, much improved, and very much improved scores.
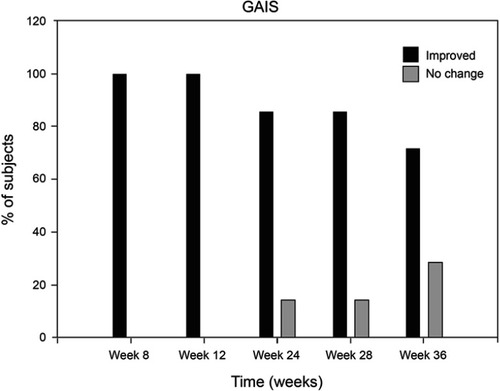
Figure 7 Subject’s photographs at baseline and at weeks 9, 28, and 36 exhibiting overall skin quality improvements after treatment with CPM®-HA20G.
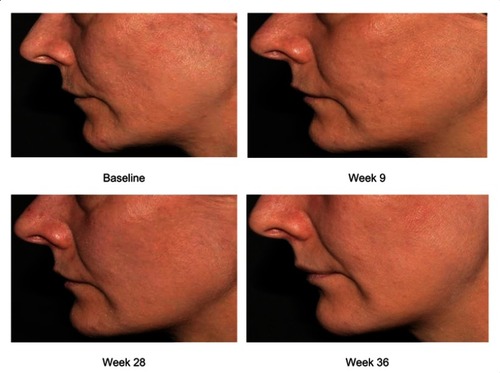
Table 3 Number (n [%]) of subjects with treatment-emergent adverse events related to the CPM®-HA20 device or its injection (Safety Evaluation Set, N=25). Eighty-four percent of the subjects experienced at least one related TEAE. All of them were mild or moderate in severity