
Figures & data
Table 1 Primer sequences, ultraviolet study on reconstructed human epidermis
Figure 1 Example of Visia-CA photos of three subjects selected at random, to illustrate the method used. Left-hand column, day 0; middle column, day 28; right-hand column, day 56. Images are captured under conditions of (A) cross polarized light, to show brown spots, (B) normal light, showing visible spots, and (C) a UV lamp, to show UV spots. Subjects consented to use of images.
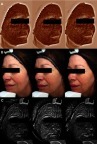
Figure 2 Example of a skin deformation curve produced from Cutometer assessment. Modified with permission from Courage and Khazaka. R0 (Uf), in mm=measurement of firmness, maximum deformation. Low values=firmer skin. R2 (Ua/Uf)=ratio between maximum deformation and return to original position. Measurement of elasticity. The closer the value is to 1 (100%), the more elastic the skin.
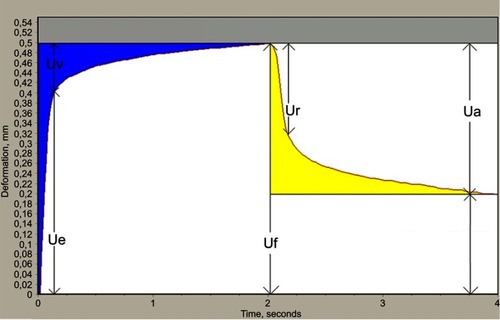
Figure 3 SBCs in (left to right) non-irradiated untreated control, irradiated untreated control and irradiated product-treated skin (SBCs indicated with arrows, showing as dark, condensed and/or fragmented nuclei and bright pink eosinophilic cytoplasm) (objective lens ×40). Digital images were captured with a NIKON DS-Ri1 and processed with NIS-Elements 4.13.04 software.
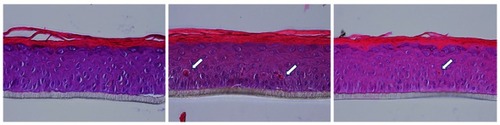
Figure 4 Skin sections following CPD immunostaining (green), and nuclear staining with propidium iodide (red): (A and D) non-irradiated control; (B and E) irradiated untreated control; (C and F) irradiated product-treated group.
Abbreviation: CPD, cyclobutane pyrimidine dimers.
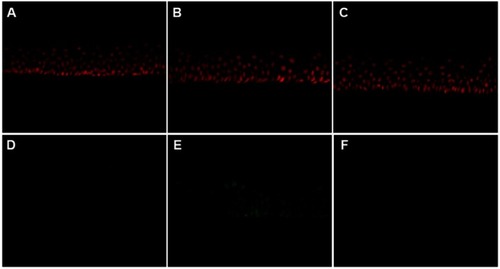
Figure 5 Gene expression levels in the UV irradiation study. Levels in irradiated untreated skin expressed relative to non-irradiated control. Levels in irradiated product-treated skin expressed relative to irradiated control. Fold-changes <0.5 or >2 (yellow dashed line) were considered significant.
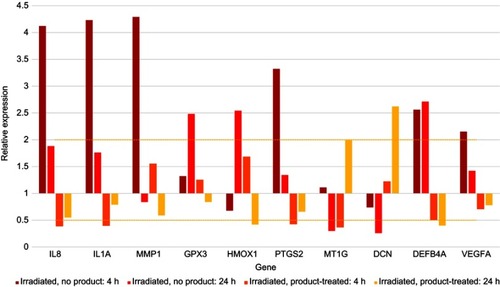
Figure 6 Nrf2 immunostaining slides. Staining is weaker in skin treated with the product than in untreated skin. Pictures digitalized with numeric DP72 Olympus camera with CellD storing software.
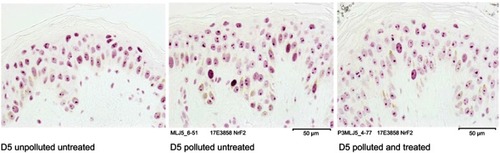
Figure 7 Mean (SD) MDA levels at day 5.
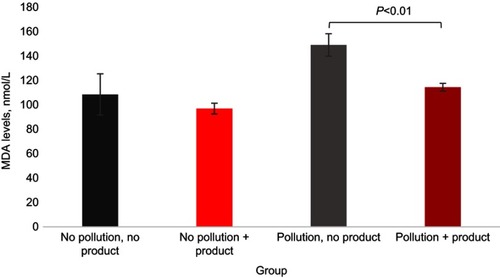
Figure 8 Gene expression levels in pollution study. Levels expressed relative to unpolluted untreated control group. Fold-changes of <0.6 or >1.45 (yellow dashed line) were considered significant.
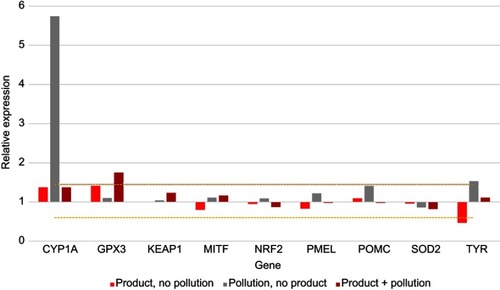
Table 2 Clinical anti-aging study: subject characteristics
Table 3 Subject questionnaire responses