Figures & data
Figure 1 CONSORT flow chart illustrating the flow of subjects through the study.
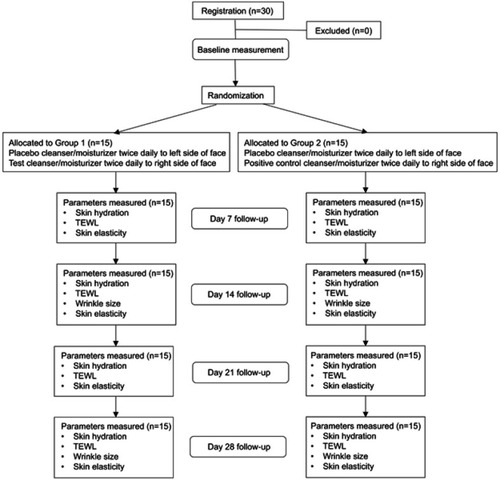
Figure 2 Skin deformation curve obtained with a cutometer depicting the immediate deformation or skin extensibility (Ue), delayed distension (Uv), final deformation (Uf), immediate retraction (Ur), total recovery (Ua) and residual deformation at the end of the measuring cycle (R).
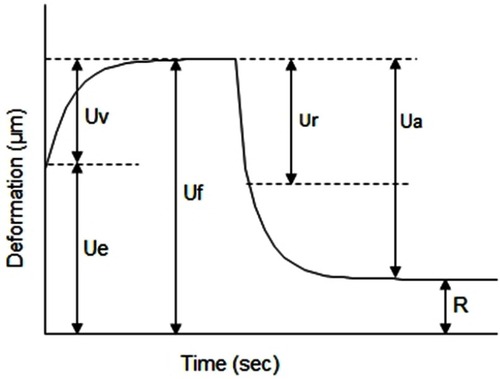
Figure 3 Mean percentage change in hydration scores over time (days) as determined by corneometer for facial skin of subjects following a skin care routine for 28 days using (●) placebo, n=30 subjects (■) positive control, n=15 subjects and (△) test cleanser/moisturizer, n=15 subjects. Results are presented as mean ± SEM. †P<0.01 versus placebo.
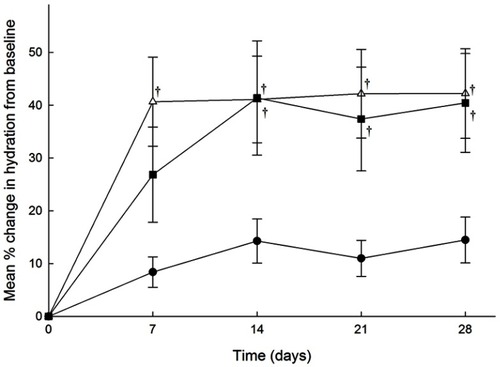
Figure 4 Mean percentage change in transepidermal water loss (TEWL) scores over time (days) as determined by tewameter for facial skin of subjects following a skin care routine for 28 days using (●) placebo, n=30 subjects (■) positive control, n=15 subjects and (△) test cleanser/moisturizer, n=15 subjects. Results are presented as mean ± SEM.
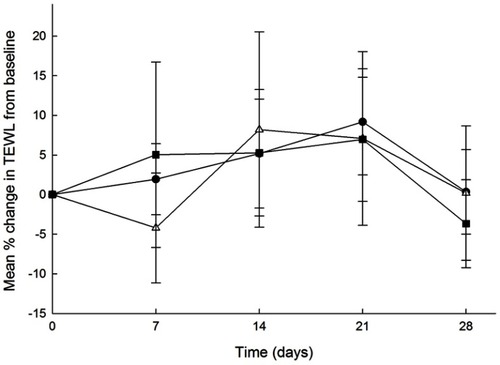
Figure 5 The mean percentage reduction in wrinkle surface, wrinkle length and wrinkle depth as determined by photonumerical grading using the Visioline RD of the crow’s feet area for facial skin of subjects following a skin care routine for 14 or 28 days using (■) placebo, n=30 subjects (![]()
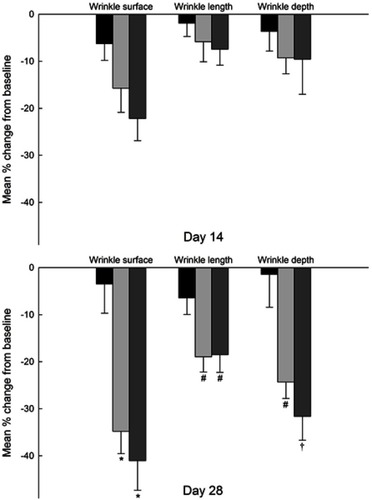
Figure 6 Photographs of (A) 72-year-old, (B) 51-year-old, (C) 59-year old and (D) 41-year-old women who applied the placebo cleanser/moisturizer to the left side of the face (LHS) and the test cleanser/moisturizer to the right side of the face for 28 days. Fine wrinkles are decreased and the skin is smoother on the RHS compared to the LHS.
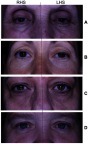
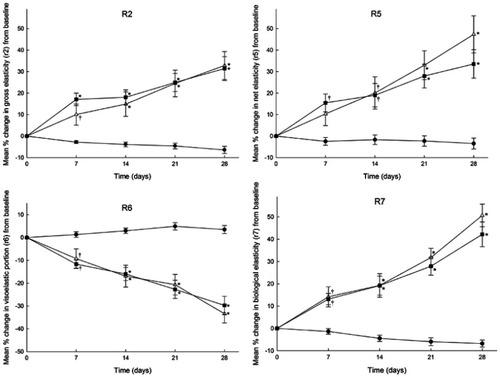
Figure 7 Mean percentage increase in skin elasticity parameters R2 (gross elasticity), R5 (net elasticity), R6 (viscoelastic portion) and R7 (biological elasticity) versus time (days) as determined by cutometer for facial skin of volunteers following a skin care routine for 28 days using (●) placebo, n=30 subjects (■) positive control, n=15 subjects and (Δ) test cleanser/moisturizer, n=15 subjects. Results are presented as mean ± SEM. *P<0.001 versus placebo, †P<0.01 versus placebo.