Figures & data
Figure 1 Skin roughness was evaluated by the areal topography with an optical technique using a microscope. Surface mapping was made, and the patchwork method was determined by the sum of triangle areas (1/2× base × height of a triangle). Before treatment, the sum of the triangle areas was 366 (left panel). Seven months after treatment, the sum of triangle areas decreased to 231.5, and it revealed that roughness of skin improved in the ischial area after multi layered calcium hydroxylapatite (CaHA) injection (right panel).
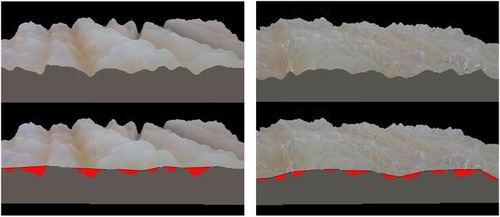
Figure 2 Photographs with the same lighting for a 39-year-old women who had previous phase of chronic sitting pressure sore. Before treatment (left panel). After 7 months post injections of diluted CaHA, depressed ischial areas were volumized, and dark pigmented skin was also treated (right panel).
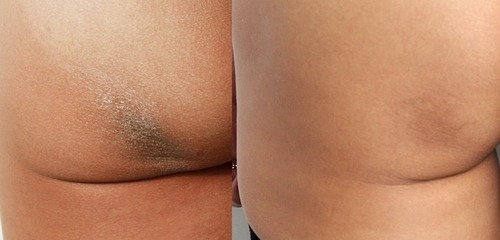
Figure 3 Low magnification of dermascope view (10×). Before treatment, there were oblique skin folds on buttock with scale-4 depression (more than 2 mm) (left panel). Seven months after treatment, oblique skin folds, and the depression were improved (right panel).
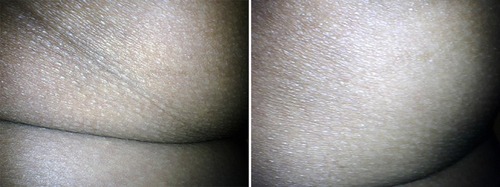
Figure 4 High resolution of dermascope view (100×). Before treatment, the skin was rough and chapped with keratinization (left panel). Skin roughness improved and looked smooth with less keratinization on the surface (right panel).
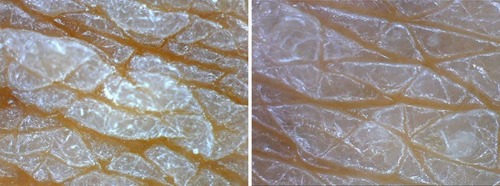
Table 1 Improvement of depressed areas, skin roughness, and skin discoloration
Figure 5 H&E stain (100× magnification) showed inflammation cells (FGCs, lymphocytes, macrophages) and collagen deposition in the dermis of treated ischial area. There were various sizes of CaHA particles. Larger than 40-micron particles might be injected 1 month before the biopsy (1 m: 1 month) and a thin collagen layer was observed around the particle (1 m) without infiltration of the giant cell. There were many fibroblasts around the particles (1 m) (see ). Whereas dense deposits of thicker coarse-shape reinforced collagen fibers (C) were observed around smaller than 20-micron particles (7 m) that were injected 7 months before the biopsy. Around smaller than 20-micron particles (7 m), numerous FGCs and macrophages were also observed. FGCs ingested and cleaved CaHA particles (white arrows) into smaller sizes during chronic inflammation.
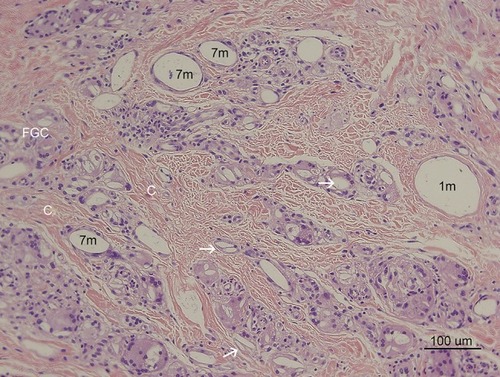
Figure 6 CaHA particle (1 m) in with 400× magnification. The large size particle was likely injected recently and particle might be injected 1 month before the biopsy. The particle was not surrounded by giant cells or macrophages (Mp), only fibroblasts (*) as shown here. This CaHA particle (1 m) was surrounded by five fibroblasts, which may have contributed newly made thin collagen fibers (Cf), even at 1 month post injection.
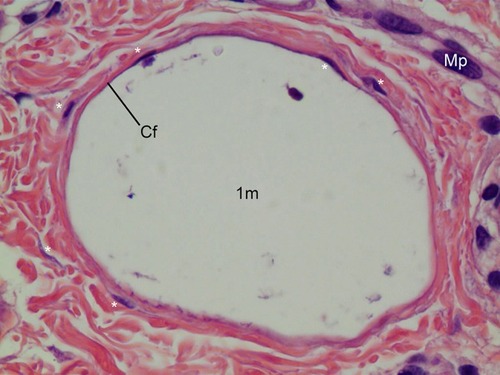
Figure 7 200× magnification on the left area of (H&E stain). Particles smaller than 20 microns were assumed to be particles that were injected 7 months before the biopsy and demonstrated late stage of inflammation in tissue reaction. FGCs (black arrow) ingested and cleaved CaHA particles and showed CaHA biodegradation. FGCs always positioned between new collagen fibers and CaHA particles (white arrows). The nuclei were centrally placed and overlapped each other in most FGCs. In some FGCs, ingested CaHA particles had displaced nuclei of FGCs peripherally. But in a few giant cells, the nuclei were arranged on the border as horseshoe shape like Langhans giant cell (red arrow). New vessels (empty black arrows) with a red blood cell its inside was visible and and demonstrated neovascularization by CaHA filler. A eosinophil (Eo) was found.
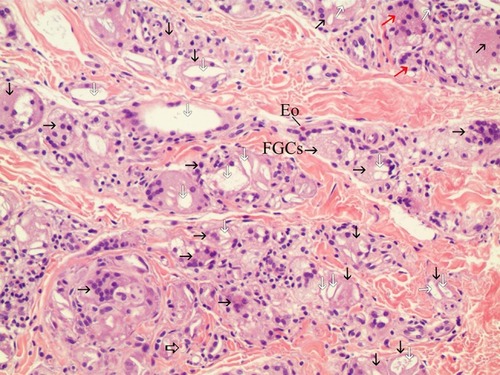
Figure 8 FGCs with asteroid body in H&E staining (400×). FGCs were ingesting a 10–30-micron CaHA particle (white arrow), while macrophages were ingesting particles smaller than 10 microns in the dermis. Around FGCs there were coarse and thicker (reinforced) collagen fibers that differed from pre existing, thin, regularly organized patterned collagen fibers. Asteroid bodies (ABs) were visible in FGCs. The right upper giant cell contained a Schaumann body (SB). Many fibroblasts(*) were found around FBCs.
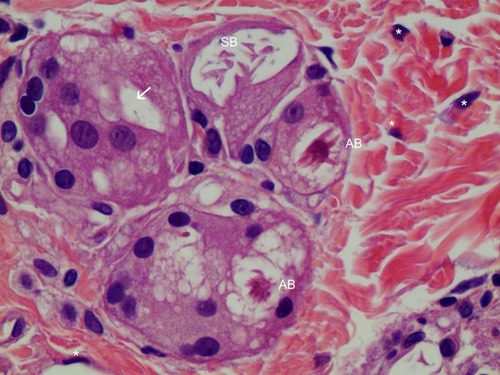
Figure 9 H&E staining of FGC (400× magnification). Very thin new collagen fibers (Cf) were observed in the dermis between two FGCs and these finding showed collagen fibers were continually created as inflammation processes, if foreign body materials (CaHA particles) existed. Foamy (from 12 o’clock to 3 o’clock) FGCs ingested CaHA particles (white arrows). FGC nuclei were peripherally placed and were overlapping each other. Numerous fibroblasts (*), macrophages (Mp), and lymphocytes (L) were found around FGCs.
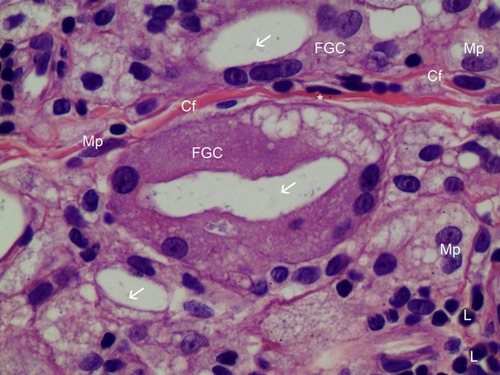
Figure 10 Mast cells and FGCs in 400× H&E staining. Two mast cells (M) were observed in the dermis, alongside three FGCs ingesting CaHA particles. CaHA particles (white arrow) were visible always in FGCs. Thick, irregularly arranged, fibroblast-produced reinforced collagen fibers (C) were seen between FGCs. Numerous fibroblasts (*) surrounded the matured collagen fibers (C).
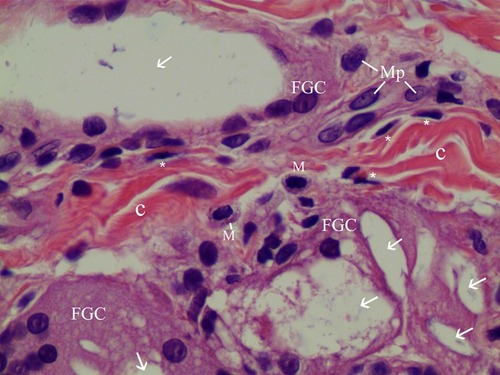
Figure 11 Herovici’s staining (100× magnification) in the same dermis area as the H&E stain in . Herovici’s stain distinguishes red-stained mature reinforced collagen (C) and red-stained existing collagen (Pc) prior to filler injection from newly formed (young) collagen (blue). Around filler particles and giant cells, abundant new or immature collagen or type-3-Collagen and reticular fibers were observed and stained blue. The reinforced mature collagen (C) showed a thicker and irregular pattern, while pre existing collagen (Pc) showed a regular pattern with regular thickness.
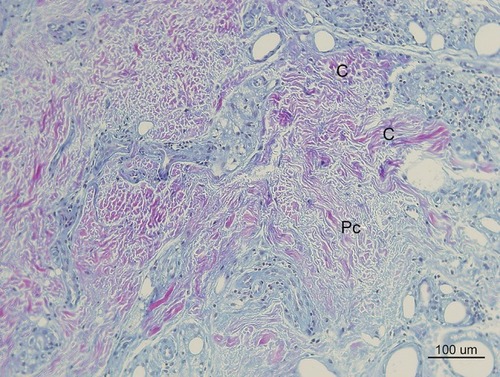
Figure 12 In Masson’s Trichrome stain, collagen stained blue (100× magnification). Thick irregularly arranged and blue-stained collagen bundles (C) deposited around CaHA particles (7 m) injected 7 months pre-biopsy, while finer, thinner, and more indistinct blue collagen fibers were assumed to be pre existingd collagen around 40-micron (recently injected) particles (1 m). Abundant FGCs (stained light brwon) and its nuclei (dark brwon dots) observed around smaller CaHA particles. (Pre existing collagen fibers: “Pc”, Reinforced mature collagen: “C”).
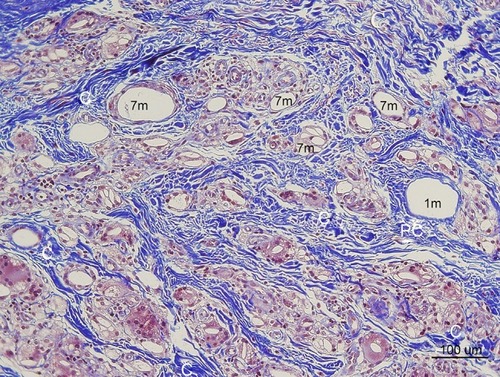
Figure 13 Type III Collagen antibody stain (100×) in the same area of ,,. Collagen-III fibers (3) appeared brown around and between particles (1 m, 7 m) in the dermis. The shape was in various thicknesses, from thick and densely stained Collagen-III to very thin Collagen-III fibers. Abundant type-III collagen was observed even 7 months after injection of CaHA filler and this is very first finding. This means new collagen (Type II I and I both) was created continually if CaHA particle existed. Abundant FGCs (stained light blue) and its nuclei (dark blue) observed around smaller CaHA particles in Type-III collagen antibody stain.
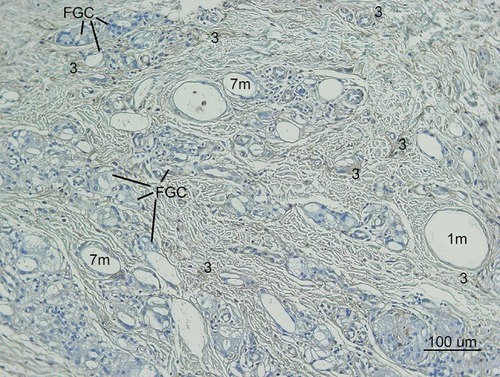
Figure 14 Non polarized PSR staining (100×). Collagen stained red. Pre existing collagen (Pc) showed regular arrangements, whereas thicker irregular patterned matured and reinforced collagen fibers (C) were thicker, denser, and differed in shape and arrangement. A thin, pinkish, and single layer (Cf) was visible around a recently injected particle (1 m) and between FGCs, suggesting a recently made collagen fiber. Abundant Very thin and new collagen fibers (Cf) were observed between FGCs.
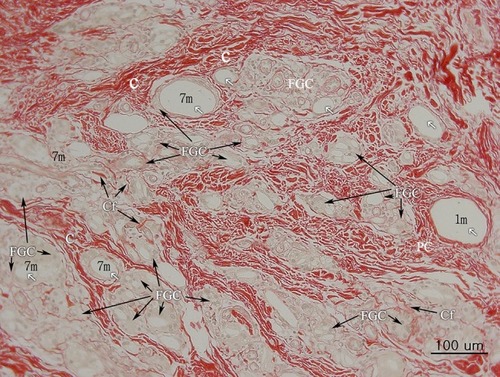
Figure 15 Polarized PSR (200×). Collagen-I stained orange-red (1) and Collagen-III stained green-yellow. Fine green lines (3) of Collagen-III are shown to be in contact with CaHA particles (white arrows).
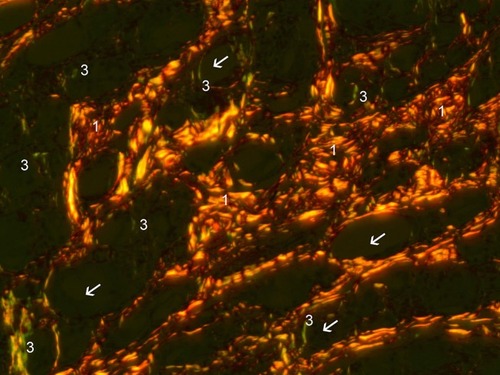
Figure 16 Changes in immune cell appearance, shape, and size of CaHA particles, and collagen levels. (Upper) Immune cell appearance at corresponding stages of inflammation. Within the first few minutes of injury, platelets in the blood begin to stick to the injured site. Platelet-derived growth factors are released into the wound that causes the migration and division of cells during the proliferative phase of the inflammation phase. Within a few hours, polymorphonuclear neutrophils (PMN) arrive at the wound site and become the predominant cells in the wound for the first 2 days after the injury or injection, and phagocytosis debris and kill bacteria. Then, macrophages appear in the wound or injected area for phagocytosis bacteria and damaged tissue. Macrophage also functions in regeneration for wound healing and also stimulates to create granulation tissue and lay down a new extracellular matrix. When macrophages cannot clean the foreign body, macrophages fused together and became a foreign body giant cell (roughly 1 month after injection of CaHA filler). In fibroplasia and granulation tissue formation, fibroblasts grow and form a new, provisional extracellular matrix by excreting collagen and fibronectin. The re-epithelialization process does not occur after filler injection. (Middle) Changes in the shape and size of CaHA particles. Before injection, the size of CaHA particles was 36–52 microns. As time passes, the size was reduced, and particles were cleavaged. Larger-sized CaHA particles were surrounded only by FGCs and less than 10-micron CaHA particles by macrophages and FGCs both. (Bottom) Changes in collagen levels were associated with the amount of CaHA particle and immune cells. Initial collagen created with stimulation may be type III. As time passes, the amount of Collagen-III decreased and was replaced by Collagen-I in end stages of inflammation after CaHA biodegradation. This Collagen-I deposition may maintain somewhat the volume as CMC portion absorption. CMC was absorbed about 1 month after injection. CaHA particles were absorbed about 1 year after injection.
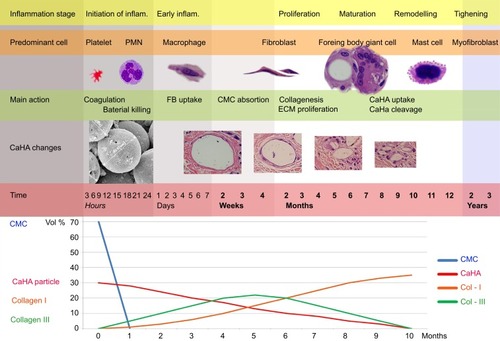
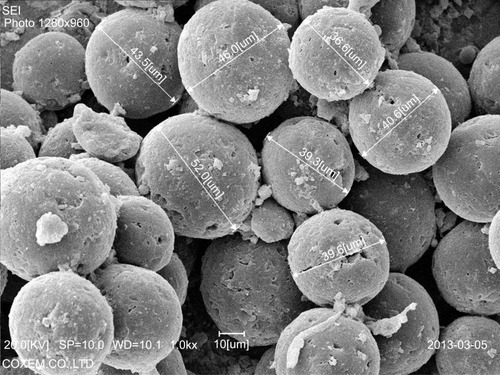
Figure 17 SEM demonstrating CaHA filler particle size as 36–52 microns at 1000× magnification. Particles had smooth surfaces, were completely spherical, and had about 3-micron-sized small holes in the surface.