
Figures & data
Table 1 Allergan Skin Roughness Scale And Allergan Fine Lines Scale Descriptors
Figure 1 Subject disposition. aSubjects who signed the informed consent form were considered enrolled. bIncluded in the primary effectiveness analysis. cThe denominator is the number of treated subjects (n=131). d3 subjects were lost to follow-up.
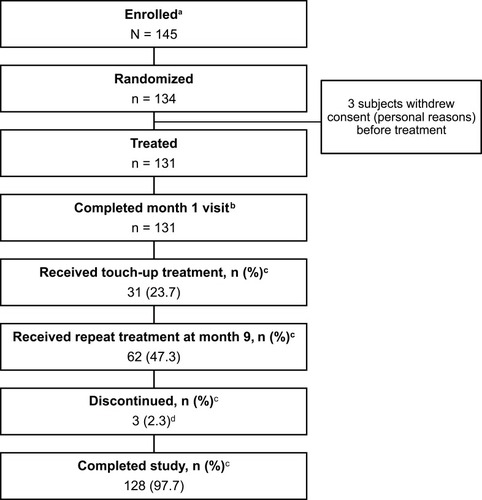
Table 2 Baseline Characteristics
Table 3 Injection Volume
Figure 2 Allergan Skin Roughness Scale (ASRS) responder rates after treatment with VYC-12. The responder rate is the percentage of cheeks with ≥1-point improvement from baseline in cheek ASRS score based on the investigator’s assessment. Each cheek of the 131 treated subjects (261 treated cheeks) was rated separately.
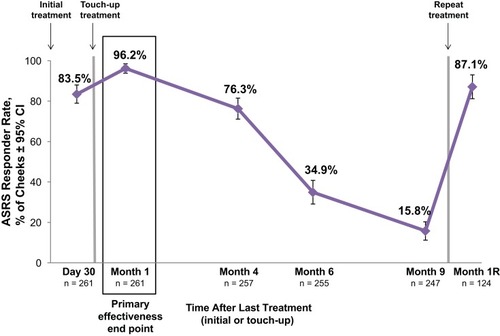
Figure 3 Allergan Fine Lines Scale (AFLS) responder rate for VYC-12 treated cheeks with AFLS scores of 2 (moderate) or 3 (severe) at baseline. The responder rate is the percentage of cheeks with ≥1-point improvement from baseline in cheek AFLS score based on the investigator’s assessment.
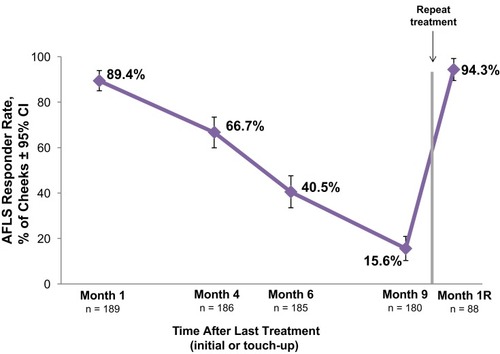
Figure 4 Cheek skin hydration measured using the MoistureMeter D instrument. Increases indicate improved skin hydration. Month 1R=1 month after repeat treatment. aP<0.001. bP≤0.012. Paired t-test was used to test for mean changes from baseline.
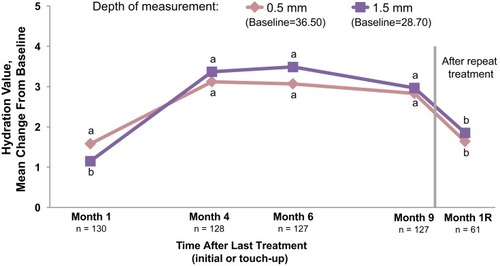
Table 4 Incidence Of Injection Site Responses In Any Treatment Area
Table 5 Treatment-Related Adverse Events