Figures & data
Table 1 List of Primers Used for Gene Expression Experiments
Figure 1 Effect of TVE on wound closure. HDF were mechanically scratched and then treated with TVE at indicate concentration and analysed after 7 hrs for the wound area measurement. The results, reported in panel A, are the averages of three independent experiments, expressed as percentages respect to the untreated cells, arbitrarily set as 100%. The error bars represent standard deviations and the asterisks indicate statistically significant values (** p value is between 0.001 to 0.01). In panel B are reported representative pictures for each treatment.
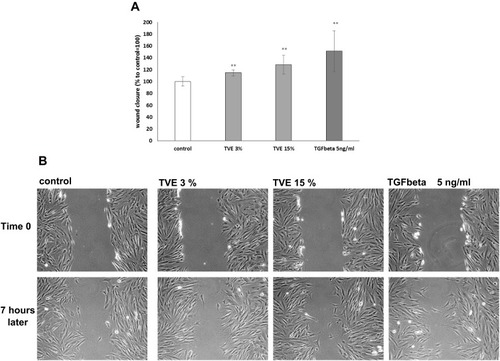
Figure 2 Effect of TVE on fibronectin gene and protein synthesis. HDF were treated with TVE at the indicated concentrations and then gene expression and protein synthesis were analysed after 6 h and 72 h, respectively. The results are the averages of three independent experiments, expressed as percentages respect to the untreated control, arbitrarily set as 100%. The error bars represent standard deviations, and the asterisks indicate statistically significant values (*** p value is between 0.0001 to 0.001; **0.001 to 0.01; *0.01 to 0.05).
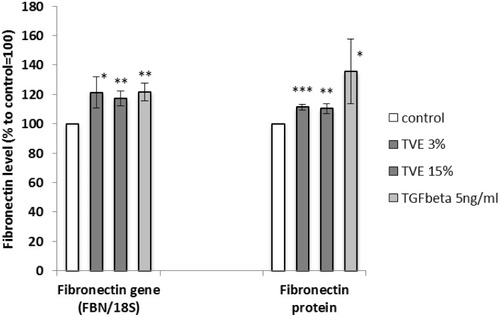
Figure 3 Effect of TVE on Fibronectin protein localization. HDF were treated with TVE at the indicated concentrations and after 72 h they were processed for immunofluorescence analysis. In the panel A, it was reported the fluorescence quantification corresponding to fibronectin production. The results are the averages of three independent experiments, expressed as percentages respect to the untreated control, arbitrarily set as 100%. The error bars represent standard deviations, and the asterisks indicate statistically significant values (** p value is between 0.001 to 0.01; *0.01 to 0.05). In the panel B, they were reported representative pictures for each treatment.
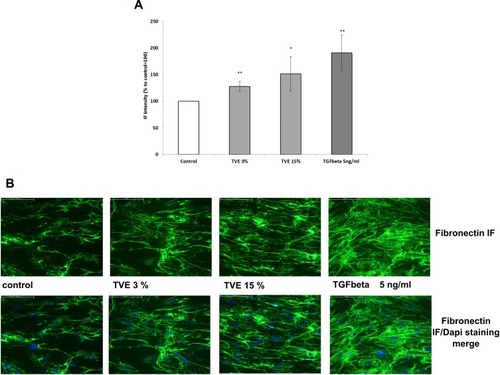
Figure 4 Effect of TVE on hyaluronan synthase 2 gene expression. HDF were treated with TVE 3% and 15% for 6 hrs, and then gene expression was analysed. The results are the averages of three independent experiments, expressed as percentages respect to the untreated control, arbitrarily set as 100%. The error bars represent standard deviations, and the asterisks indicate statistically significant values (** p value is between 0.001 to 0.01; *0.01 to 0.05).
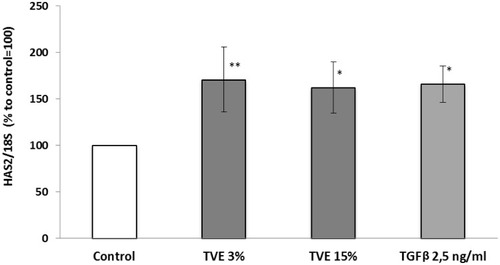
Figure 5 Effect of TVE on polymerization of actin. HDF were treated with TVE at 3% and 15% for 30 mins and then polymerized actin was measured in the cell lysates. The results are the averages of three independent experiments, expressed as percentages respect to the untreated control, arbitrarily set as 100%. The error bars represent standard deviations, and the asterisks indicate statistically significant values (*** p value is between 0.0001 to 0.001; **0.001 to 0.01; *0.01 to 0.05).
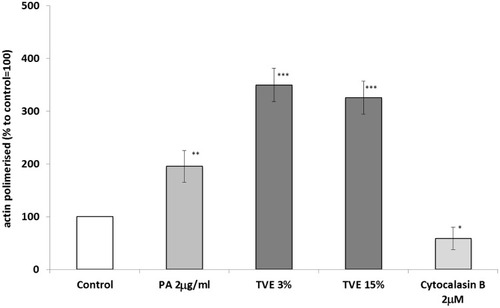
Figure 6 Effect of TVE on GBA gene expression and activity. HaCaT cells were treated with TVE at 3% and 15% for 24 hrs, and then both gene expression and enzymatic activity were measured by RT-PCR and GBA activity assay, respectively. In the panel A, it was reported the gene expression analysis, and in the panel B, the enzymatic activity. The results are the averages of three independent experiments, expressed as percentages respect to the untreated control, arbitrarily set as 100%. The error bars represent standard deviations, and the asterisks indicate statistically significant values (* p value is between 0.01 to 0.05).
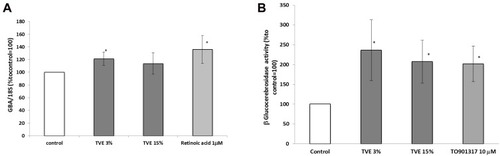
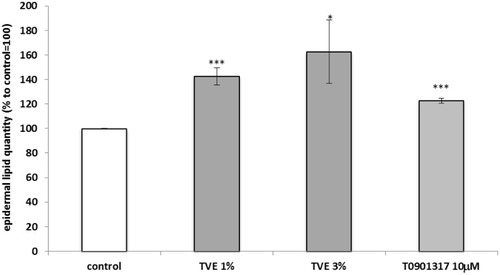
Figure 7 Effect of TVE on epidermal lipid production. HaCaT cells were treated with TVE for 24 hrs and then stained with Nile Red. In the graph, there are reported the average results of three independent experiments, expressed as percentages respect to the untreated control, arbitrarily set as 100%. The error bars represent standard deviations, and the asterisks indicate statistically significant values(*** p value is between 0.0001 to 0.001; *0.01 to 0.05).