
Figures & data
Figure 1 Gel hydration capacity. A photo showing an amount of fillers (160 mg), before and after swelling in PBS. The increase in volume is noticeable. The gels were stained with toluidine blue to better visualize phase separation and were centrifuged before acquiring the image. It is evident that AFL and ASR did not reach their maximum swelling under these conditions. The image gives an idea of the relative hydro-action of the gels.
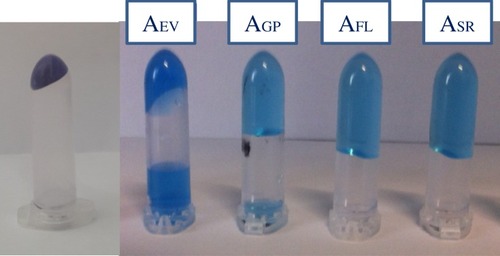
Figure 2 Rheological parameters of the HA-based fillers. Complex modulus (G*) (A) and tan delta values (B) determined within the linear viscoelastic range, at 1.59 Hz frequency. Shear stress vs strain curve (C). Values of complex viscosity measured at 0.159, 0.7 and 2 Hz frequency at a strain value within the linear viscoelastic range (D).
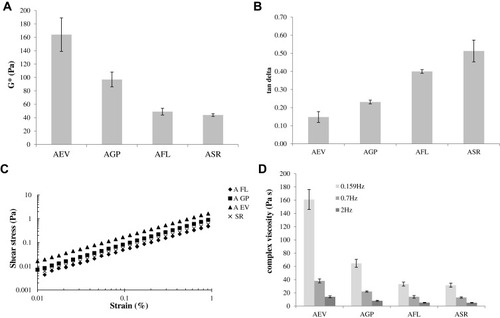
Figure 3 Gel degradation in the presence of ROS. (A) G′ values for the gels during incubation with ROS, compared to a control (filler incubated with water). (B) Quantitative evaluation of the degradation rate: extent of G′ decreases, normalized to the control (%), at increasing time of incubation with the ROS generating system. The data refer to a single measurement.
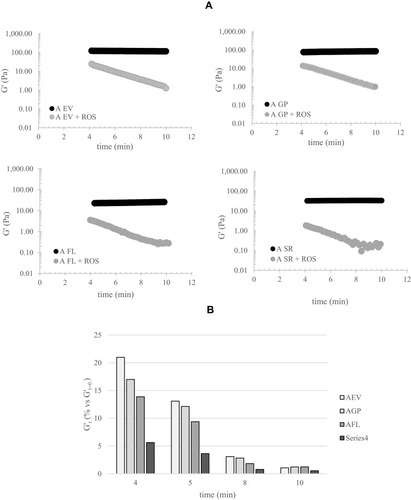
Figure 4 Results of the cohesivity test. (A) Representative images captured at diverse time points of the experimentation (15ʺ, 70ʺ and 90ʺ). (B) Cohesivity score attributed to the gels by four raters according to the Sundaram–Gavard scale.
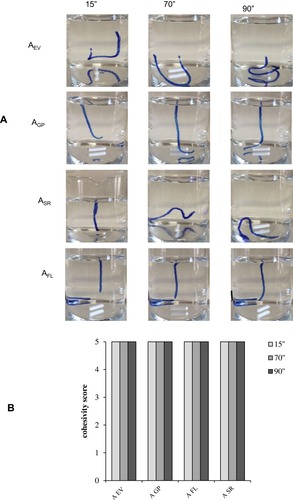
Figure 5 Representative pictures of two patients obtained before and 12 months after the last of three treatments performed at 3-month intervals. Patients provided written informed consent for the use of the images for scientific research.
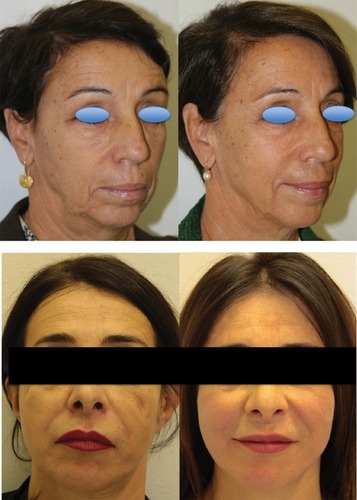
Table 1 Degree of Satisfaction Determined 3, 6 and 12 Months After Injections in the 56 Patients