Figures & data
Table 1 Demographic and Clinical Data of the SCC and BCC
Figure 1 A case of SCC. (A) Moderate-to-strong nucleocytoplasmic expression of ATG7 both in tumor and the surrounding stoma. (B) High power view of previous case. (C) Mild-to-moderate nucleocytoplasmic immunohistochemical expression of ATG7 in sebaceous gland (ATG7 IHC ×200 for A and C and ×400 for B).
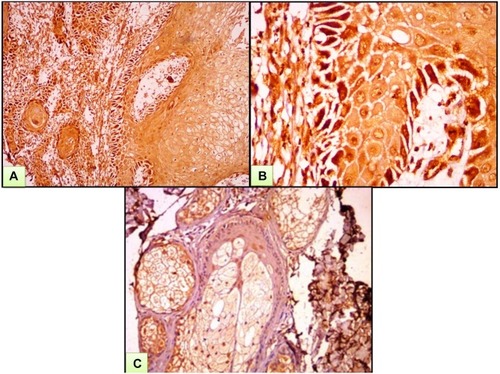
Figure 2 A case of BCC. (A) Strong nucleocytoplasmic expression of ATG7 both in tumor and surrounding stroma. (B) High power view of previous case. (C) Strong immunohistochemical expression of ATG7 in cut section of hair follicle (ATG7 IHC ×200 for A and B and ×400 for C).
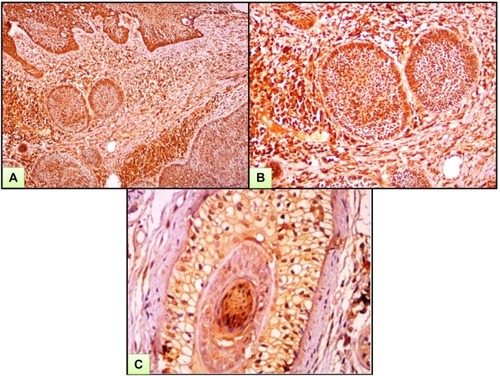
Figure 3 Normal skin. (A) Epidermis showed mild to moderate cytoplasmic expression of ATG7. (B) Dermis showed mild nucleocytoplasmic expression of ATG7 in hair follicle and eccrine sweat glands (ATG7 IHC ×200 for A and B).
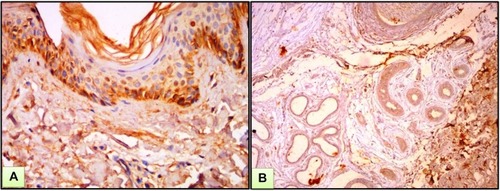
Table 2 Comparison Between Studied Groups Regarding ATG7 Expressions
Table 3 Relation Between ATG7 H Score and Clinical Parameters of the Patients
Table 4 Relationship Between ATG7 H Score (Epithelial and Stromal) and Clinical Parameters in SCC Patients
Table 5 Relationship Between ATG7 H Score (Epithelial and Stromal) and Clinical Parameters in BCC Patients
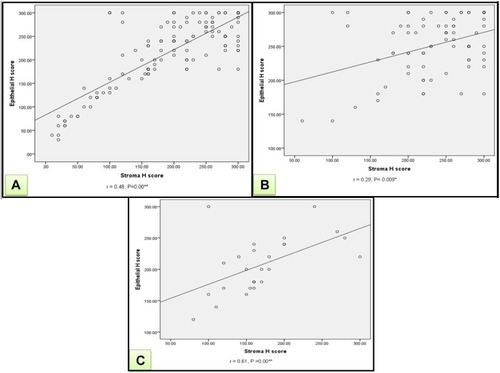
Figure 4 (A) A significant positive correlation between H score (epithelial & stromal) of ATG7 in all patients (r=+0.48, P=0.00). (B) A significant positive correlation between H score (epithelial & stromal) of ATG7 in BCC patients (r=+0.29, P=0.009). (C) A significant positive correlation between H score (epithelial & stromal) of ATG7 in SCC patients (r=+0.61, P=0.00).