Figures & data
Figure 1 Line diagram of Negroid African hairstyling techniques and how they overlap. Adapted Roseborough IE, McMichael AJ. Hair care practices in African-American patients. Semin Cutan Med Surg. 2009;28(2):103–108.Citation6
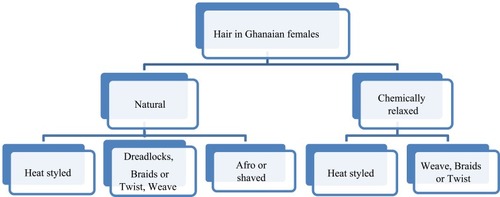
Figure 2 (A-C): Bar charts showing shaft and medulla features of hair strands from women with the three different styling methods. (A) shows hair shaft diameter. Error bars represent SD. (B) shows proportions of hair strands in which the medulla was present or absent. (C) shows proportions of medullary types in the hair strands.
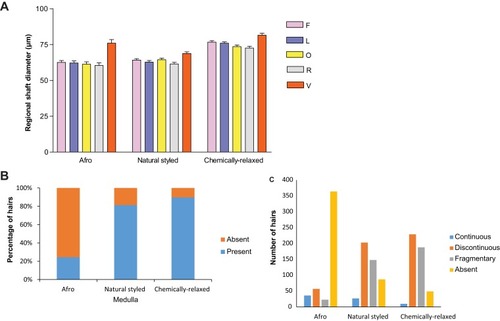
Table 1 Statistical Distribution Of Hair Shaft Diameters From Three Styling Groups, And Among The Five Scalp Areas
Table 2 Medullary Diameters And Indices For Each Hairstyle From The Five Scalp Regions
Figure 3 (A-C): Micrographs showing the cortex and medulla of hair from different parts of hair strands from various hairstyle groups. (A) shows the cortex (C) and medulla (M) of proximal hair, whereas (B) and (C) show strands from middle and distal parts, respectively.
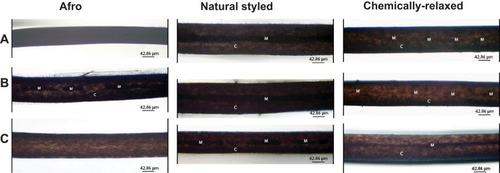
Figure 4 (A, B): Bar charts showing occurrence of conventional descriptive scale features among hair fibers from women with the three grooming styles studied. (A) shows the number of hair fibers that showed conventional scale patterns. B shows the number of hairs that had the cuticular scale margins conventionally described as crenate, smooth, and rippled.
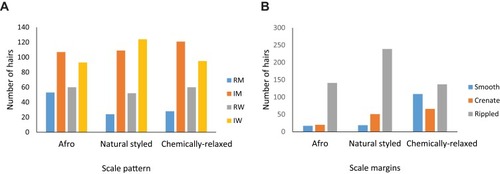
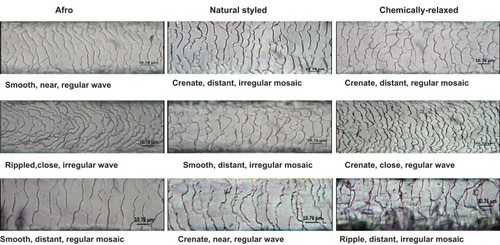
Figure 5 Micrographs showing samples of conventional descriptive patterns and margin morphologies of cuticular scales found among the three grooming styles studied. Scale casts were prepared, and images digitally captured as described in the 'Materials and Methods' section; tone, contrast, and color of images were enhanced to make scales more visible.