Figures & data
Figure 1 (A) Percentage of patients who achieved success based on the global acne assessment score of 0 (clear) or 1 (almost clear). (B) Changes in acne lesion counts; mean of comedones throughout the follow-up sessions. (C) Changes in acne lesion counts; mean of papules throughout the follow-up sessions. (*p-value <0.05 comparison to baseline within the group, † p-value <0.05 for comparison of PDT with RT gel and PDT with ALA).
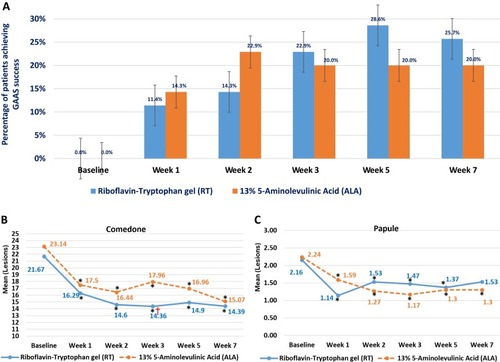
Figure 2 (A) Acne reduction compared between before (baseline) and (B) after treatment (at week 7) on the facial side treated with PDT with RT gel. (C) Acne reduction compared between before (baseline) and (D) after treatment (at week 7) on the facial side treated with PDT with ALA.
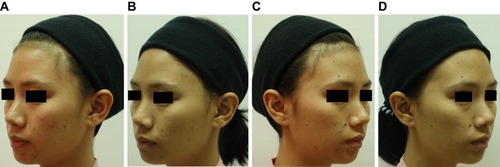
Figure 3 Fluorescence photographs (A) before and (B) after the treatment. In this patient, the right side of the face was treated with PDT with RT gel and the other side was treated with PDT with ALA.
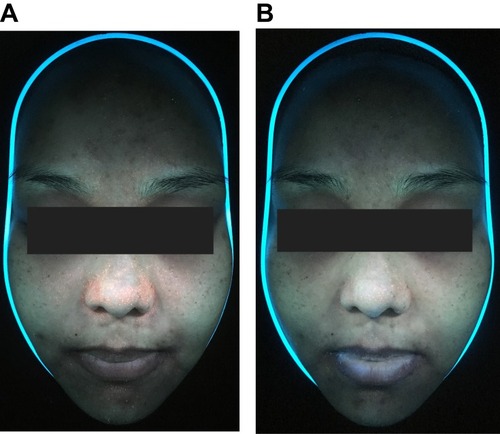
Figure 4 (A) Mean of porphyrin grading throughout the follow-up sessions. (B) Mean of sebum output throughout the follow-up sessions. (*p-value <0.05 comparison to baseline within the therapeutic group, † p-value <0.05 for comparison of PDT with RT gel and PDT with ALA).
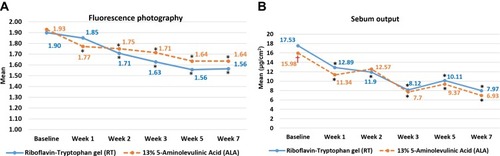
Figure 5 (A) Macroscopic images of the facial skin on the target area of the cheek treated by PDT with RT gel. (B) The volume of the target area of the cheek treated by PDT with RT gel. (C) The roughness index of the target area of the cheek treated by PDT with RT gel, measured by Antera 3D at every evaluation.
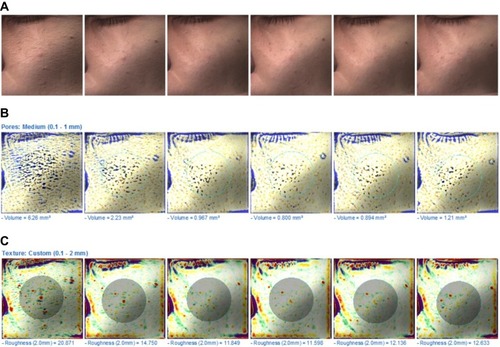
Figure 6 (A) Macroscopic images of the facial skin on the target area of the cheek treated by PDT with ALA. (B) The volume of the target area of the cheek treated by PDT with ALA. (C) The roughness index of the target area of the cheek treated by PDT with ALA, measured by Antera 3D during every evaluation.
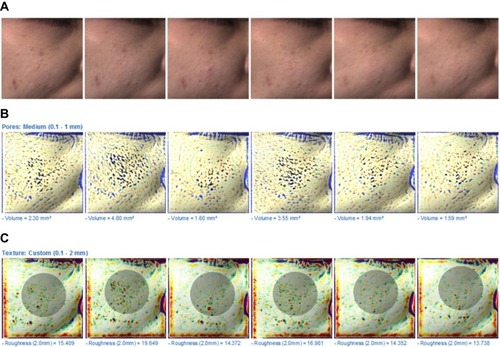
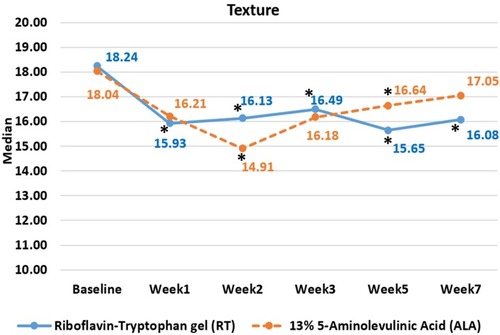
Figure 7 Linear graph illustrating the median value of volume (*p-value <0.05 compared to baseline within the group).
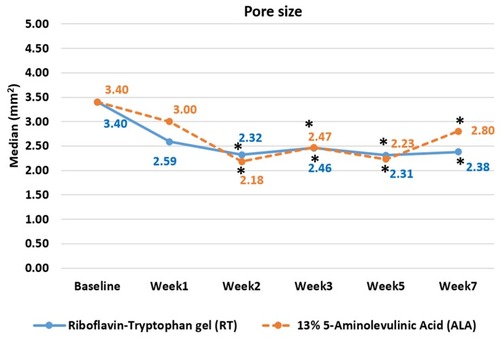
Figure 8 Linear graph illustrating the median value of roughness index (*p-value <0.05 compared to baseline within the group).