
Figures & data
Figure 1 The flowchart of the study.
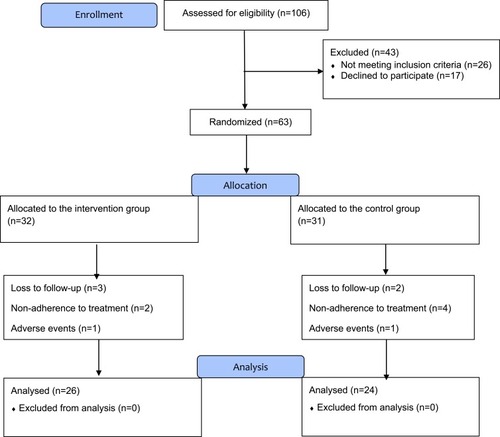
Table 1 Baseline Demographic and Clinical Characteristics of the Per Protocol Population
Figure 2 (A) Mean hand eczema severity index (HESI) score at different time points during study (P-value<0.001). (B) Mean pruritus score based on the VAS scale at different time points during study (P-value<0.001).
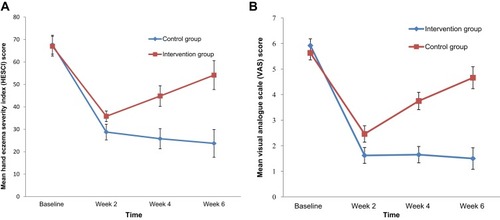
Table 2 Comparison of Eczema Severity Based on the HECSI Tool Between 2 Groups at Different Time Points During the Study (as Mean ± SD)
Table 3 Comparison of Pruritus Severity Based on the VAS Scale Between 2 Groups at Different Time Points During the Study (as Mean ± SD)
Table 4 Comparison of Prevalence Distribution of HECSI Severity Between 2 Groups at Different Time Points During the Study
Table 5 Comparison of Prevalence Distribution of VAS Severity Between 2 Groups at Different Time Points During the Study
Table 6 Comparison of the Impact of Skin Disorder on Patients’ Quality of Life Based on the DLQI Score in the Two Groups at Baseline and at the End of the Study Period (as Mean ± SD)