Figures & data
Figure 1 Flow cytometry of CD4+CD25+Foxp3+Treg cells that cultured after depletion of CD8+ T cells from PBMCs. CD8+T cells were eliminated from PBMCs by MACS separation methods. CD4+CD25+ Treg cells were incubated with Treg sol in KBM502 medium. After 14 days, Cultured Treg cells were analyzed by BD Accuri TM C6 Plus. (A) Portion of CD4+CD25+Foxp3+ cells after 14 days of culture without Treg sol in KBM502. (B) Portion of CD4+CD25+Foxp3+ Treg cells after 14 days of culture treated with Treg sol in KBM502.
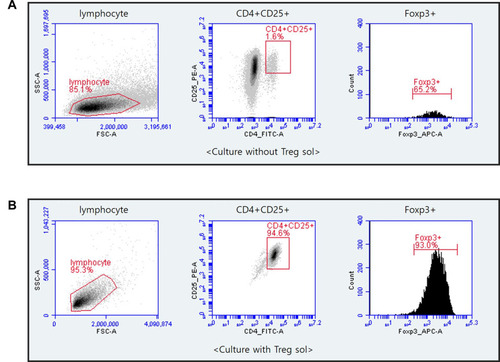
Figure 2 Cytokine array of Treg cells CM. Treg cells isolated from PBMCs were incubated with KBM502 medium. (A) Treg cells CM was detected by Davinchi Chemi doc. Left image is the results of media only (Control), right image is the results of Treg cells CM. (B) The table shows the cytokine sites of each dot about (A). (C) Relative intensity of each cytokine was determined by Densitometric analysis. (n = 3).
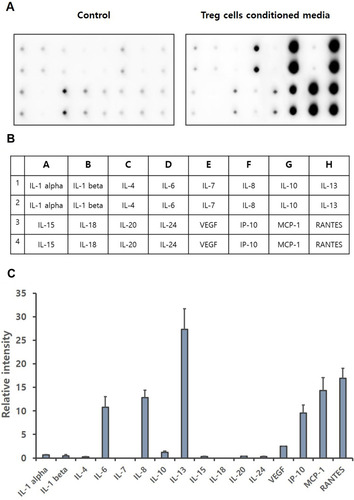
Figure 3 The effect of Treg cells CM on the cell proliferation of HaCaT keratinocytes. HaCaT cells were incubated with indicated concentration of Treg cells CM in 1% FBS DMEM. Proliferation of HaCaT keratinocytes was determined by MTT assay after 24 hours treatment of Treg cells CM. The results were expressed as the means and standard deviation (n = 4). **P < 0.01; ***P < 0.001 versus no-treatment control (Con).
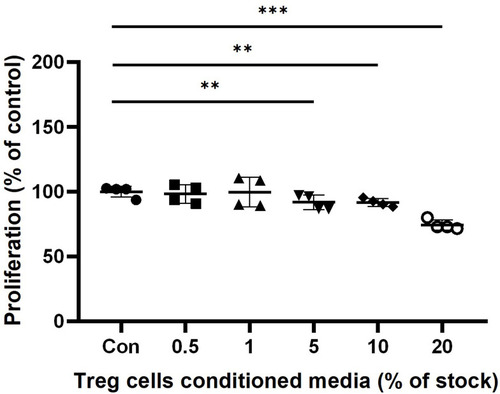
Figure 4 The effect of Treg cells CM on the cell migration of HaCaT keratinocytes. The indicated Treg cells CM treated for 24 hours. Confluent HaCaT keratinocytes monolayer about 95%-100% were scratched. And the scratched cells were incubated in fresh medium without Treg cells CM. (A) Microscopic images were obtained immediately on monolayer of scratched cells after 24 hours. (B) Cell migration was determined by measuring the reduction of the scratched area. The results were expressed as the means and standard deviations (n = 3). *P < 0.05; **P < 0.01 versus no-treatment control (Con).
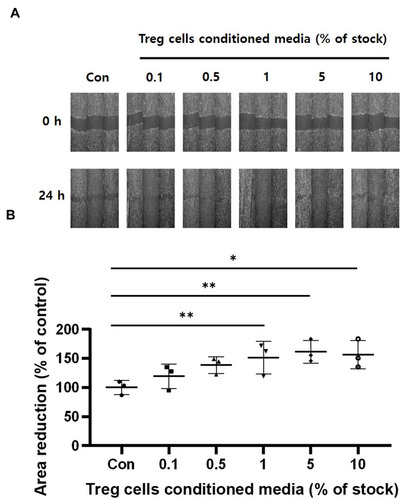
Figure 5 The effect of Treg cells CM on down-regulation of E-cadherin in HaCaT keratinocytes. HaCaT keratinocytes were cultured on glass cover slips with the indicated concentrations of Treg cells CM for 24 hours. The cell monolayer was scratched and incubated with fresh medium without Treg cells CM for 24 hours. (A) E-cadherin was detected by Immunofluorescence staining. (B) Relative intensity was determined by Densitometric analysis using ImageJ software. The results were expressed as the means and standard deviations (n = 3). *P < 0.05, ***P < 0.001 versus no-treatment control (Con).
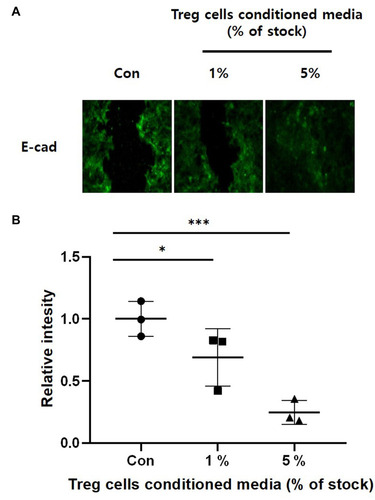
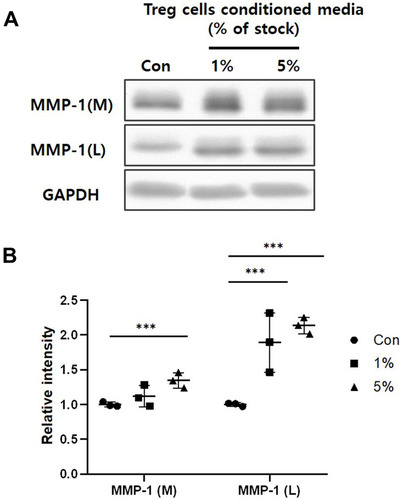
Figure 6 The effect of Treg cells CM on the MMP-1 expression and secretion of HaCaT keratinocytes. (A) MMP-1 of whole cells lysate (L) and media (M) was detected by Western blot analysis. (B) Relative intensity of MMP-1 was determined by Densitometric analysis. Loading control for MMP-1 was GAPDH. The results were expressed as the means and standard deviations (n = 3). ***P < 0.001 versus no-treatment control (Con).