
Figures & data
Figure 1 Addition of 1% colloidal oat reduces the time to detection of S. epidermidis, S. aureus, and C. acnes in monoculture. Shown are the means of five replicate assessments (n=5); error bars denote standard deviation. *p<0.01 vs control, **p<0.05 vs control, ***p<0.001 S. epidermidis vs S. aureus (unpaired two-tailed Student’s t-test).
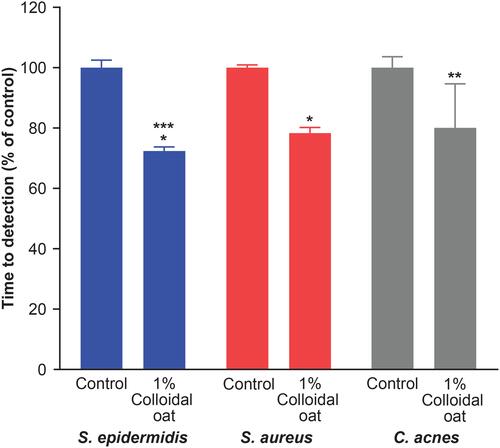
Figure 2 Addition of 1% colloidal oat selectively increases the growth rate of S. epidermidis versus S. aureus in an in vitro competition assay. Shown are the time course of bacterial growth (mean with standard error) over 24 hours (A) and final titers (mean with standard deviation) after 24 hours (B). *p<0.05 vs control (two-tailed Mann–Whitney test).
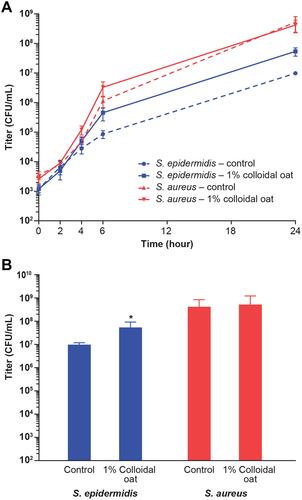
Figure 3 SCFAs (A) and lactic acid (B) in supernatants of monocultures of skin bacteria. Heat map and bar graph show mean values of analyses performed in triplicate. Error bars denote standard deviation. *p<0.01 vs control (unpaired two-tailed Student’s t-test).
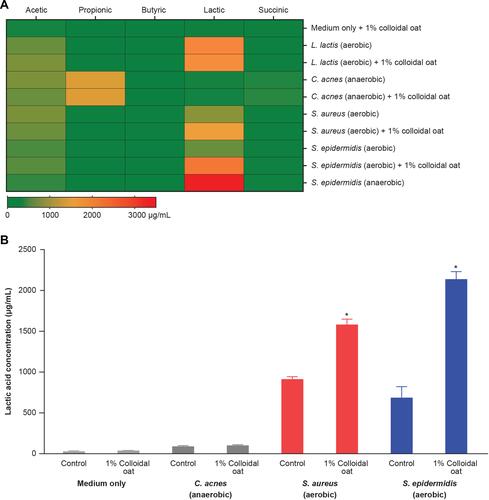
Figure 4 Unsupervised hierarchical clustering analysis of S. epidermidis metabolic activity under different culture conditions.
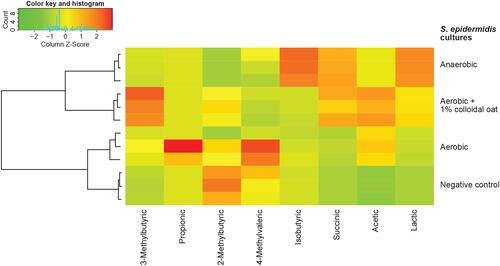
Figure 5 Treatment with a daily moisturizing lotion containing 1% colloidal oat significantly increased the lactic acid content in moderate to severe dry skin (n=6). Error bars denote standard deviation. *p < 0.05 vs baseline (paired t-test).
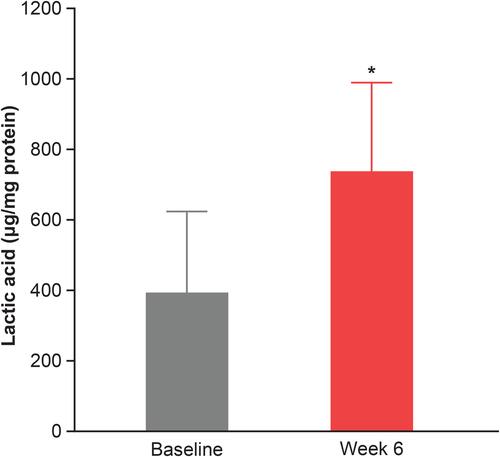
Table 1 Enriched KEGG Pathways of S. epidermidis Differential Gene Expression in the Presence of 1% Oat