
Figures & data
Table 1 Characteristics of the Study
Table 2 Partial Correlation Model Between Plasma Glutathione and MASI Score
Figure 1 Scatter plot correlation between melasma area severity index score with glutathione plasma shows a downward line (negative correlation).
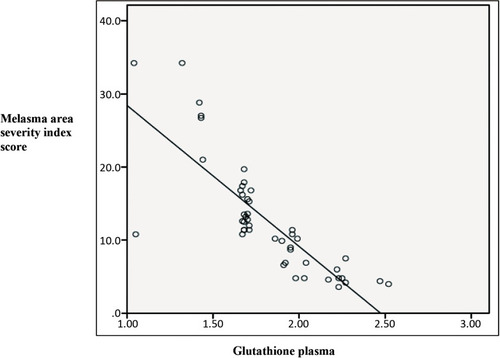
Table 3 Linear Regression Analysis on Plasma Glutathione with the Severity of Melasma Based on MASI Score