
Figures & data
Table 1 Patient Characteristics and Baseline Demographics
Figure 1 Dermatological assessment for Comb Test. Number of hairs collected after the hair comb test were counted and separated as hair fall with bulb and hair fall without bulb at visit 1, visit 6, visit 8 and visit 10; Values are expressed in Mean ± SE; *p<0.05 by t-test.
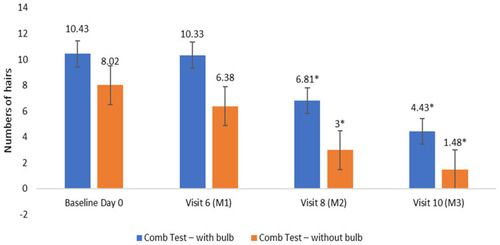
Figure 2 Hair Thinning evaluation by Image comparison. Hair fall was measured using MSCR 10-point photo-numeric hair thinning scale which was compared with the image taken from VISIA CR imaging, lower the grade better the result, values are expressed as Mean ± SE, *p<0.05 by t-test.
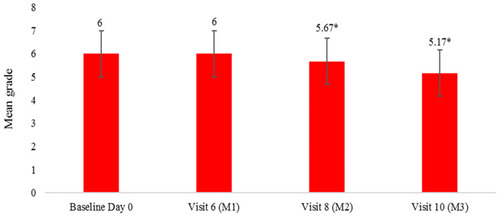
Figure 3 (A) Hair fall assessment by linear photo numerical scale. Hair fall was assessed using MSCR 10-point photo-numeric hair thinning scale compared with the scalp of the subjects directly during their study visits; Lower the value better the result; values are expressed as mean grade ± SE. (B) Hair pull test assessment results. Hair was firmly tugged away from the scalp as fingers slide along the hair shaft and the number of extracted hairs were counted. Values are expressed as mean number of hairs per pull ± SE, *p<0.05 by t-test.
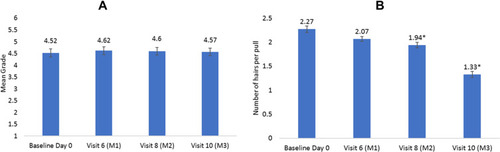
Figure 4 TrichoScan® Assessment in 1 cm2 shaved area of the scalp. (A) Assessments of hair density as number of hairs per cm2. (B) Assessments of Hair Growth rate as length of hair grown per 2 days. (C) Assessment of anagen and telogen %. (D) Density of terminal and vellus hair as the number of hairs per cm2. Values are expressed as mean ± SE; *p<0.05 by t-test.
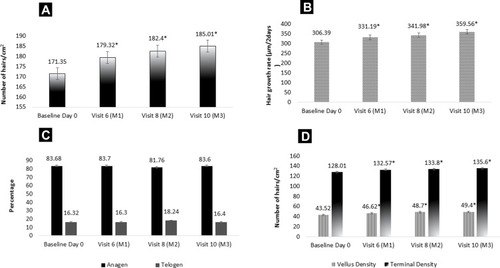
Table 2 Changes in Self-Assessment Questionnaire, Mean (SD)
Table 3 Quality of Life Questionnaire (Change from Baseline to Final Visit)