
Figures & data
Table 1 Demographic and Clinical Features of Patients in Treatment Groups
Figure 1 Clinical pictures of patients with various hair regrowth scale (RGS), (A) RGS 0 (<10%), (B) RGS 1 (11–25%), (C) RGS 2 (26–50%), (D) RGS 3 (51–75%), (E) RGS 4 (>75%).
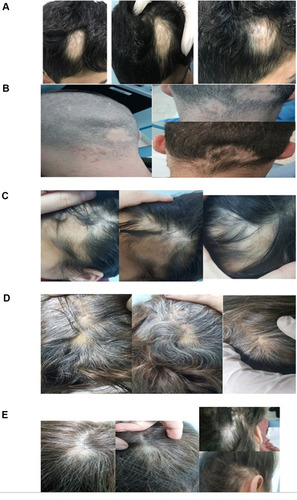
Figure 2 A patient with occipital and temporal patches showing complete hair regrowth after single injection of ILT10 mg/mL.
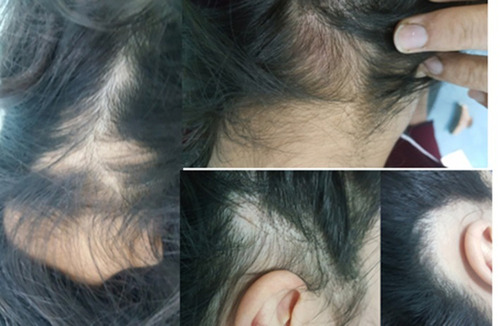
Figure 3 Skin atrophy observed at sites of ILT injection (arrows).
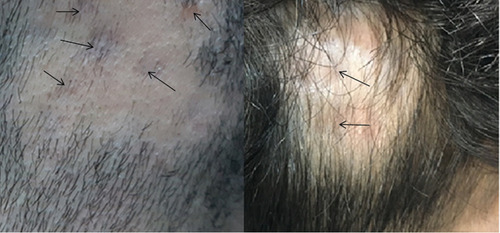
Table 2 Inter-Group Comparison of Response to Treatment
Table 3 Results of Multivariate Analysis