
Figures & data
Table 1 Sample Population
Table 2 The Prevalence of Skin Sensitivity in Different Ages
Figure 1 Venn diagram of sensitive skin and skin symptoms.
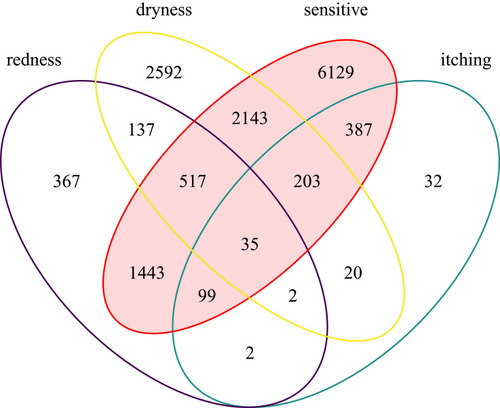
Table 3 Sensitive Skin Prevalence According to the Declaration of Skin Types
Table 4 Sensitive Skin Prevalence According to the Geographical Areas
Figure 2 Logistic regression evaluating predictive factors for the skin sensitivity.
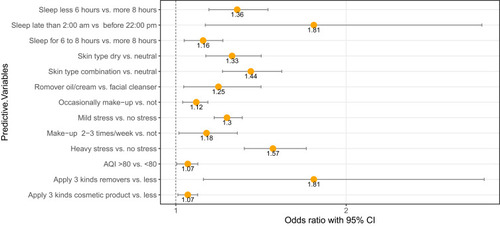
Table 5 Sensitive Skin Prevalence According to the Usage of Cosmetic Product and Life Style
Table 6 Prevalence of Self-Declared Sensitive Skin in Various Geographies