
Figures & data
Table 1 Statistical Characteristics of Psoriasis Severity, Quality of Life and Stigmatization Levels Determined with the 6- and 33-Item Scale
Figure 1 Distributions of the quality of life (C) scores and stigmatization levels determined with the 6- (B) and 33-item scale (A).
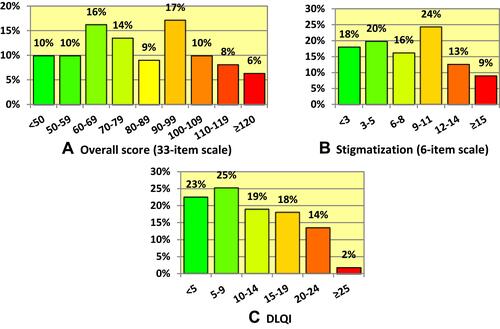
Table 2 Relationships of Psoriasis Severity with the Quality of Life and Stigmatization Levels (Spearman Correlation Coefficient)
Figure 2 Distributions of DLQI scores (A) and overall scores for the 33-item scale (B) according to PASI.
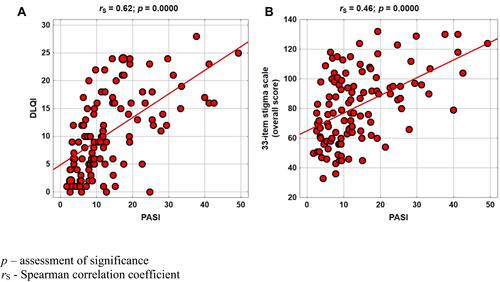
Table 3 Univariate Analysis. Relationships of Psoriasis Severity, Stigmatization and Quality of Life with Sociodemographic Variables
Table 4 Effect of Selected Demographic Factors on Stigmatization Levels and Quality of Life After the Adjustment for Disease Severity (PASI Scores) – The Results of Covariance Analysis
Figure 3 Analysis of regression; relationships of the quality of life (A) and secretiveness (B) scores with PASI, stratified according to patient gender.
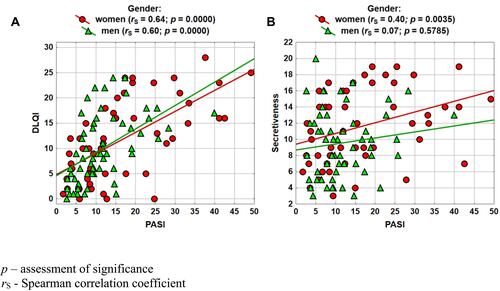
Figure 4 Analysis of covariance; relationships of the quality of life (A) and positive attitudes (B) scores with patient education.
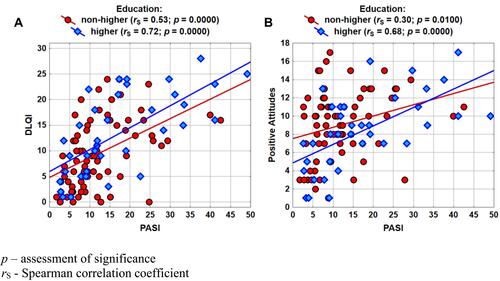
Table 5 Analysis of Regression. Relationships Between DLQI (Quality of Life) and Independent Variables – Results for Models with All Independent Variables