Figures & data
Table 1 Characteristics of the Subjects
Figure 1 Age-related change of skin hydration for the forehead (A), cheek (B), chin (C) and forearm (D), and the comparison among the four age groups (E). Hydration values are indicated by solid lines and 95% CIs by shaded area in the line graphs, and are expressed as mean ± 95% CIs in the bar graphs.
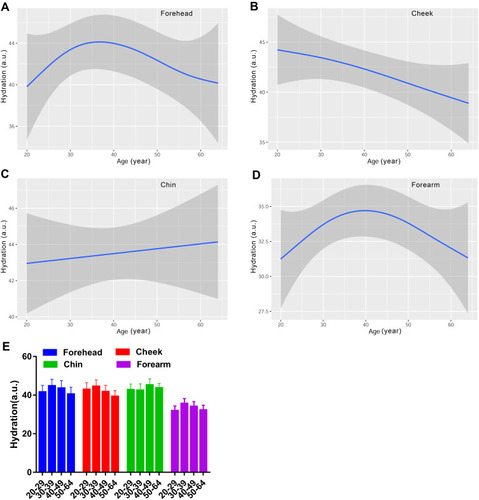
Table 2 Influence of Anatomical Regions on the Biophysical Parameters
Figure 2 Age-related change of TEWL for the forehead (A), cheek (B), chin (C) and forearm (D), and the comparison among the four age groups (E). TEWL values are indicated by solid lines and 95% CIs by shaded area in the line graphs, and are expressed as mean ± 95% CIs in the bar graphs.
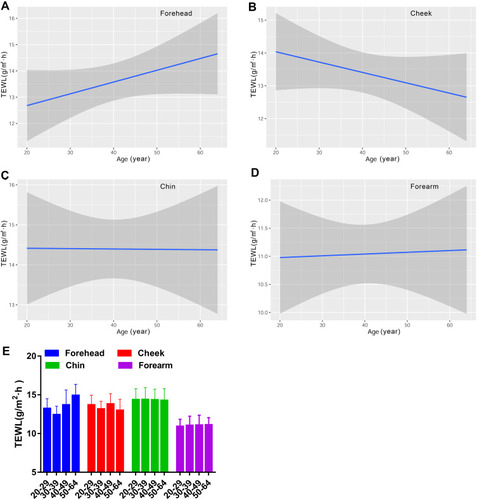
Figure 3 Age-related change of skin sebum content for the forehead (A), cheek (B) and chin (C), and the comparison among the four age groups (D). Sebum values are indicated by solid lines and 95% CIs by shaded area in the line graphs, and are expressed as mean ± 95% CIs in the bar graphs. *p <0.05, **p <0.01.
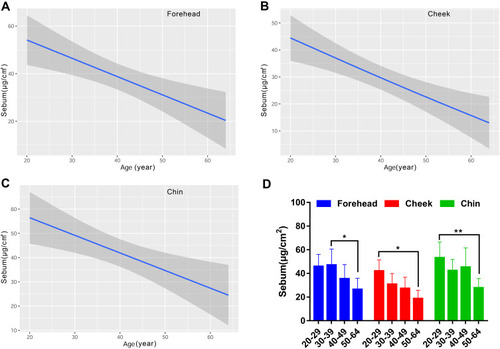
Figure 4 Age-related change of skin surface pH for the forehead (A), cheek (B), chin (C) and forearm (D), and the comparison among the four age groups (E). pH values are indicated by solid lines and 95% CIs by shaded areas, and are expressed as mean ± 95% CIs in the bar graphs. *p <0.05.
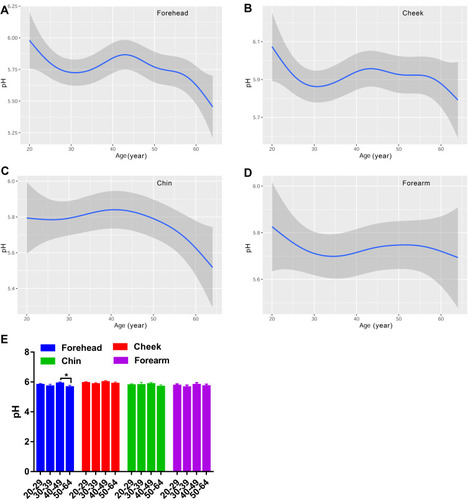
Figure 5 Age-related change of skin melanin index for the forehead (A), cheek (B), chin (C) and forearm (D), and the comparison among the four age groups (E). MI values are indicated by solid lines and 95% CIs by shaded areas, and are expressed as mean ± 95% CIs in the bar graphs. **p <0.01.
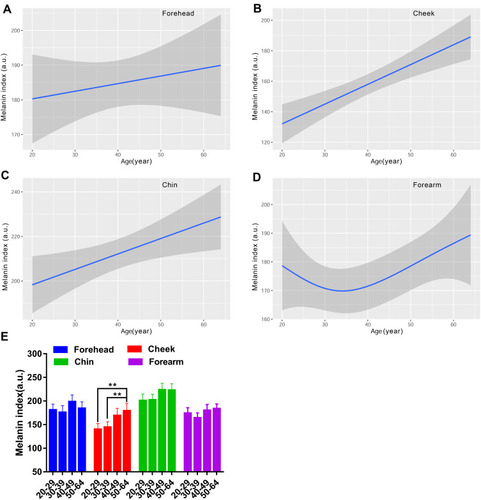
Figure 6 Age-related change of skin erythema index for the forehead (A), cheek (B), chin (C) and forearm (D), and the comparison among the four age groups (E). EI values are indicated by solid lines and 95% CIs by shaded area in the line graphs, and are expressed as mean ± 95% CIs in the bar graphs.
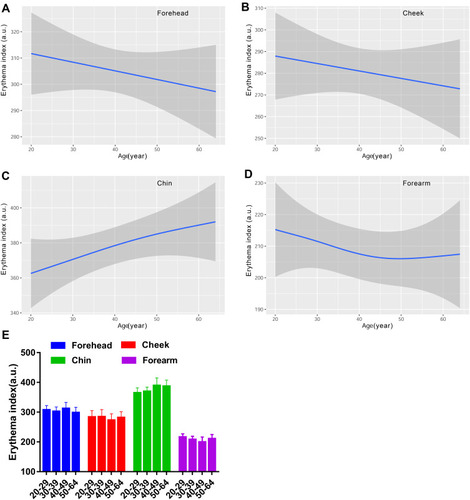
Figure 7 Age-related change of skin lightness L* for the forehead (A), cheek (B), chin (C) and forearm (D), and the comparison among the four age groups (E). Lightness L* values are indicated by solid lines and 95% CIs by shaded area in the line graphs, and are expressed as mean ± 95% CIs in the bar graphs. *p <0.05, **p <0.01.
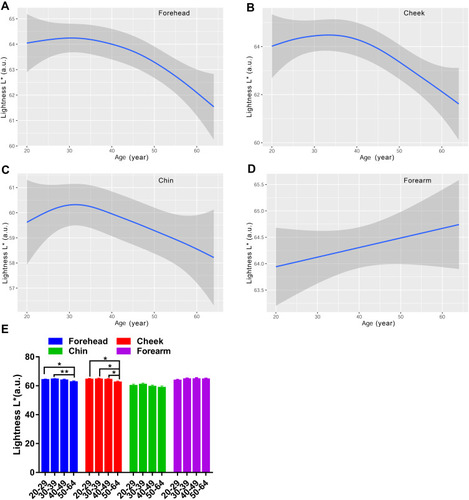
Figure 8 Age-related change of skin redness a* for the forehead (A), cheek (B), chin (C) and forearm (D), and the comparison among the four age groups (E). Redness a* values are indicated by solid lines and 95% CIs by shaded area in the line graphs, and are expressed as mean ± 95% CIs in the bar graphs. *p <0.05, **p <0.01.
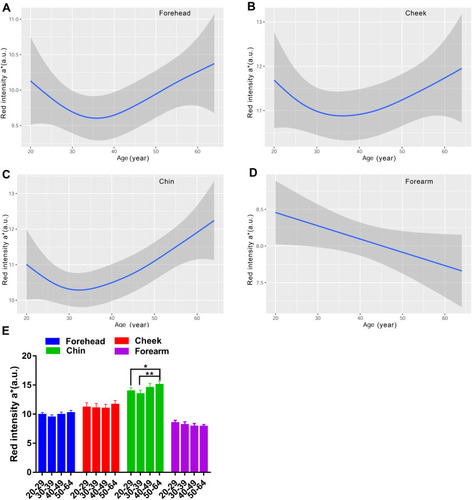
Figure 9 Age-related change of skin yellowness b* for the forehead (A), cheek (B), chin (C) and forearm (D), and the comparison among the four age groups (E). Yellowness b* values are indicated by solid lines and 95% CIs by shaded area in the line graphs, and are expressed as mean ± 95% CIs in the bar graphs. *p <0.05, **p <0.01.
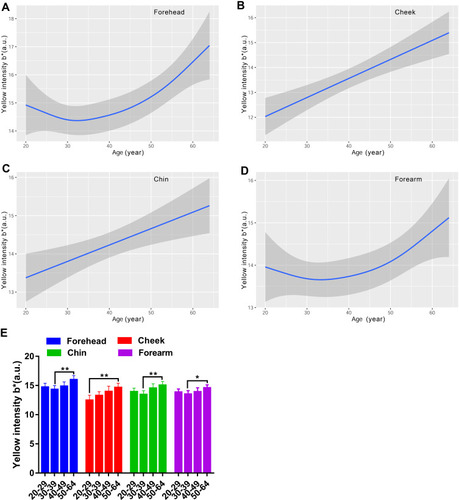
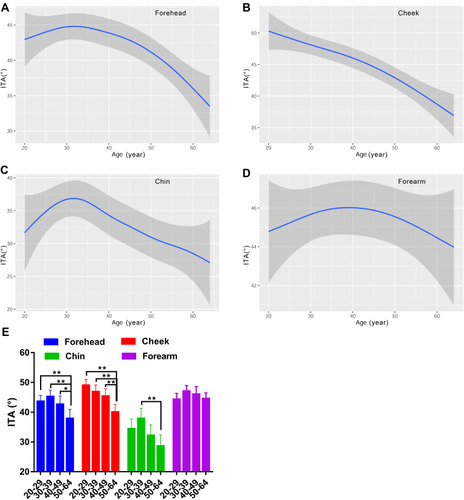
Figure 10 Age-related change of skin individual typological angle for the forehead (A), cheek (B), chin (C) and forearm (D), and the comparison among the four age groups (E). ITA values are indicated by solid lines and 95% CIs by shaded area in the line graphs, and are expressed as mean ± 95% CIs in the bar graphs. *p <0.05, **p <0.01.