Figures & data
Table 1 Mean Serum Ferritin Levels for Each Group
Table 2 The Number of Patients in Different Serum Ferritin Levels
Table 3 Binary Logistic Regression Analysis Between Telogen Effluvium and Ferritin
Figure 1 Flowchart of patients inclusion and exclusion.
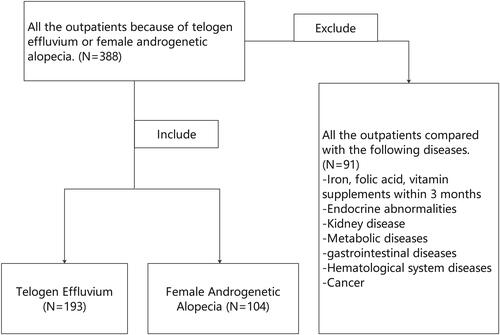
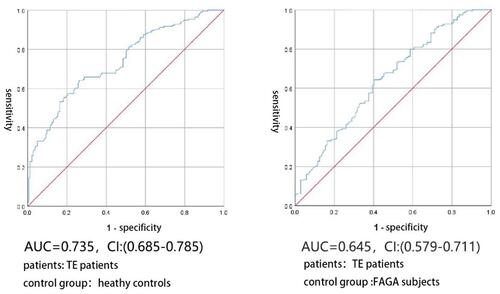
Figure 2 ROC analysis of serum ferritin levels.
Notes: The ROC curves of serum ferritin for detecting TE from health controls (HC, left) and FAGA (FAGA, right).
Abbreviations: ROC, receiver operating characteristics; AUC, area under the curve; CI, confidence interval.