
Figures & data
Figure 1 Schematic figure illustrating the injection area.

Table 1 Facial Volume Loss Scale (FVLS)
Table 2 Wrinkle Severity Rating Scale (WSRS)
Table 3 Variation of Face Volume
Figure 2 Gene expression analyses (qRT-PCR) in the treated FT-skin model were expressed as relative quantification (RQ) with respect to control. Statistical differences between mean values were determined with Student’s t-test followed by Welch’s correction. The symbols indicate a significant difference (P < 0.05) to the control (* for COLIV, # for AQP3, $ for CD44). */ # /$ (P < 0.05); **/ ##/ $$ (P < 0.01); ***/ $$$ (P < 0.01).
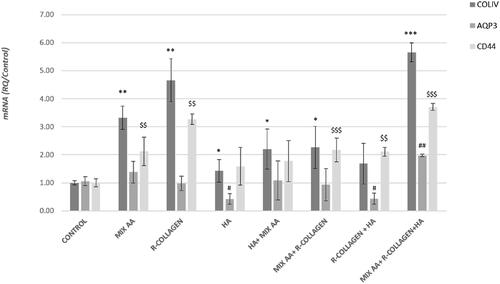
Figure 3 Representative image analysis of improvement of midface volume before treatment (T0), 7 days (T7), 30 days (T30) and 90 days after injection of the brand-new intracutaneous filler. The subject’s midface was evaluated by mean of Vectra H1.
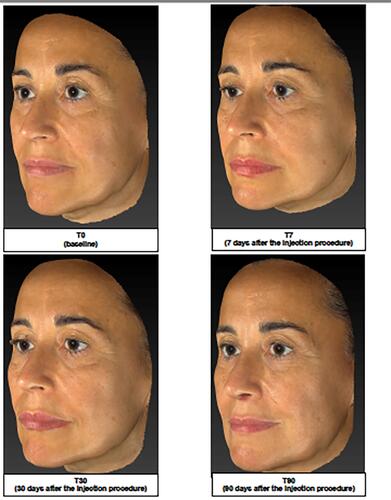
Figure 4 Representative image analysis of improvement of nasolabial folds before treatment (T0), 7 days (T7), 30 days (T30) and 90 days after injection of the brand-new intracutaneous filler. The subject’s midface was evaluated by mean of Vectra H1.
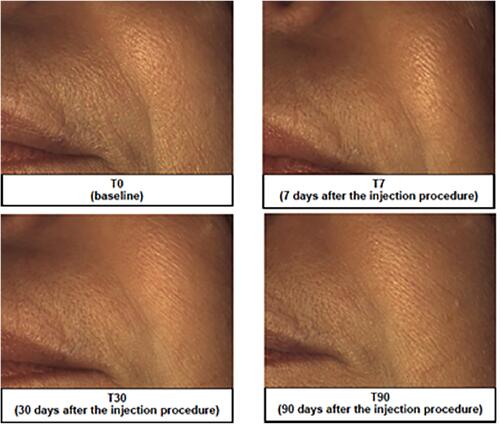
Figure 5 Representative image analysis of improvement marionette lines before treatment (T0), 7 days (T7), 30 days (T30) and 90 days after injection of the brand-new intracutaneous filler. The subject’s midface was evaluated by mean of Vectra H1.
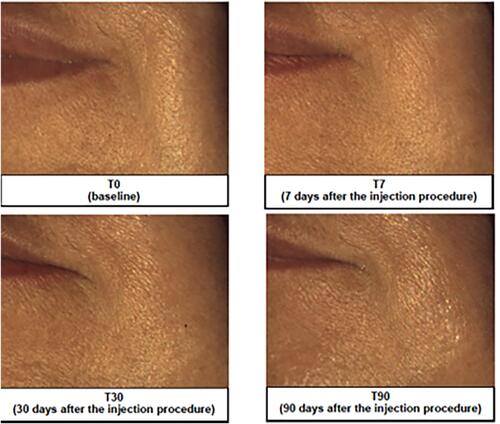
Table 4 Profilometry of Nasolabial Folds
Table 5 Profilometry of Marionette Lines
Table 6 Superficial and Deep Hydration Variations
Table 7 Investigator’s and Subjects’ Satisfaction Degree