
Figures & data
Table 1 Statistical Characteristics of the Phototherapy After the First and Second Courses of NB-UVB Phototherapy for Various Groups of Patients
Figure 1 Box and whisker plot for the relative change in psoriatic severity measure (as a percentage of the value at the start of phototherapy), after the first and second rounds of 20 narrowband UVB exposures.
Abbreviations: BSA, body surface area; PASI, Psoriasis Area and Severity Index; PGA, Physician Global Assessment.
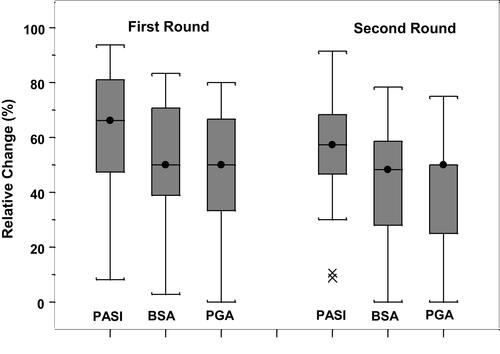
Table 2 Statistical Characteristics of the RF Classification, without Cytokine Input, for Various Sub-Groups of the Psoriatic Patients
Table 3 Ranking of Explanatory Variables from Most Important to Least Important