Figures & data
Figure 1 Flow cytometry results for MSCs. The MSCs were identified to be positive for CD29 (98.3%) and CD90 (97.6%), negative for CD45 (0.2%).
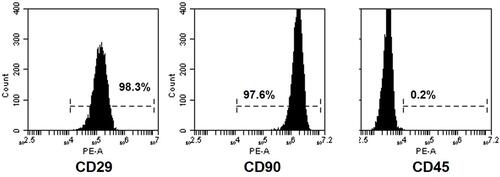
Table 1 Total Protein Content and VEGF Concentration of Three Samples. Three Samples from Same Bench of Secretome Were Used for the Tests. Mean Total Protein and VEGF Concentration of the Secretome Used for the Study Was Shown. No Significant Difference Was Observed Among the Three Samples
Table 2 Mean Wound Size at Different Time Points. On Day 5 and Day 14, Both MSCs and Secretome Reduced the Wound Size (p < 0.05 Vs Control). Secretome Further Accelerated the Wound Closure (p < 0.05 Vs MSCs)
Figure 2 Healing rate and photos of wound at different time points. (A) The percentage of wound closure. Both MSCs and secretome promoted wound closure on day 5 and day 14 (day 5: MSCs, **p < 0.01; secretome, ***p < 0.001; day 14: MSCs, **p < 0.01; secretome, ***p < 0.001). Compared with MSCs, secretome further accelerated the healing process (day 5: **p < 0.01; day 14: *p < 0.05). (B) Photos of wound at different time points. MSCs and secretome reduced the size of wound from day 5 to day 14. The wound was healed in secretome group after 28 days.
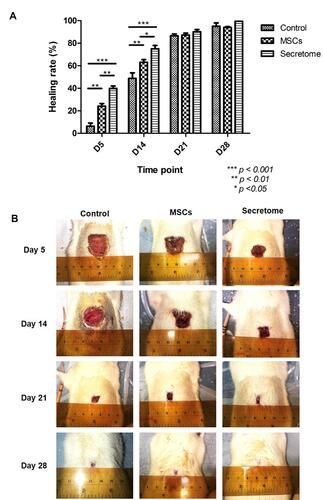
Figure 3 IHC staining of GFP, VEGF and PCNA. (A) Photo of anti-GFP staining under low magnification (100x). Two regions were indicated in the image: region a, the wound bed where the MSCs were injected into; region b, the dead tissue covered the wound area (scar). The arrows represented the migrate direction of the injected MSCs: from the lower injected site to the upper area. The red box indicated the area which was showed in the following IHC staining images. (B) Photo of anti-GFP staining at high magnification (200x). The transplanted MSCs were labelled with GFP. The GFP positive cells indicated living MSCs. On day 5 and day 10 after injection, living GFP-MSCs were found at the surrounding area of the wound. No living cells were detected after 10 days. (C) IHC staining of VEGF on day 5 and day 14. VEGF was secreted after the injury. Both MSCs and secretome increased the intensity of VEGF, secretome further stimulated the release. (D) IHC staining of PCNA on day 5 and day 14. The positive PCNA signal indicated proliferating cells. Number of PCNA positive cells was higher in the secretome treated tissue. (E): statistical result of anti-PCNA staining. The number of PCNA positive cells was significantly increased after secretome injection on both day 5 and day 14 (day 5: *p < 0.05 vs control, *p < 0.05 vs MSCs; day 14: *p < 0.05 vs control, *p < 0.05 vs MSCs). No remarkable difference was observed in MSCs treatment group.
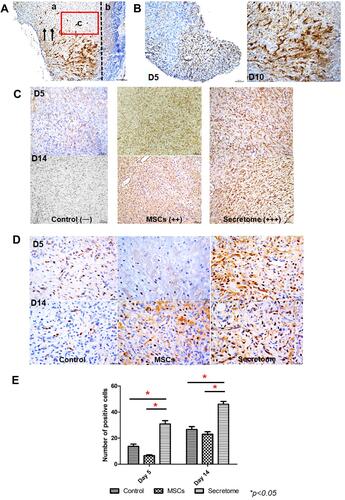
Figure 4 Inflammatory cytokines in blood samples at day 5 and day 14 examined by ELISA. (A) Level of IL-6. The expression of IL-6 was significantly reduced in day 5 and day 14 after secretome injection (day 5: ***p <0.001 vs control, *p < 0.05 vs MSCs; day 14: ***p < 0.001 vs control, *p < 0.05 vs MSCs). The MSCs injection decreased the IL-6 level on day 5 only (**p < 0.01). (B) Level of TNF-α. Both MSCs and secretome suppressed the release of TNF- α remarkably (day 5 and day 14: **p < 0.01 MSCs vs control, ***p < 0.001 secretome vs control). Compared with MSCs, secretome further reduced the secretion (day 5: ***p < 0.001; day 14: *p < 0.05).
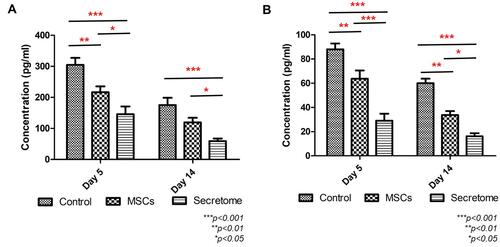
Figure 5 The cell viability, proliferation ability and mobility of FR (rat dermal fibroblasts) after treated with secretome. (A) Results of MTT indicated the highest concentration of secretome reduced the metabolic condition of FR (***p < 0.001). As the concentration decreased from 1/10 to 1/1000, secretome promoted cell viability significantly (1/10 – 1/50, **p < 0.01; 1/100, ***p < 0.001; 1/250, **p < 0.01; 1/500 – 1/1000, *p < 0.05). (B) BrdU proliferation assay indicated the proliferation ability of FR was enhanced when treated with various concentration of secretome (1/5 – 1/25, ***p < 0.001; 1/50 – 1/250, **p < 0.01; 1/500, *p < 0.05). (C) Photos of scratch test taken at 0h and 18h. Similar wound area was made at 0h. After treated with different concentration of secretome for 18h, the wound was closed at various degrees. The wound treated with secretome showed similar wound area as control (treated with DMEM). When treated with 1/5, 1/10, 1/25 and 1/50 secretome, the wound area was decreased. (D) Statistical results indicated the same finding that the wound area was reduced significantly after treated with 1/5, 1/10, 1/25 and 1/50 secretome (1/5, ***p < 0.001; 1/10, **p < 0.01; 1/25, **p < 0.01; 1/50, *p < 0.05).
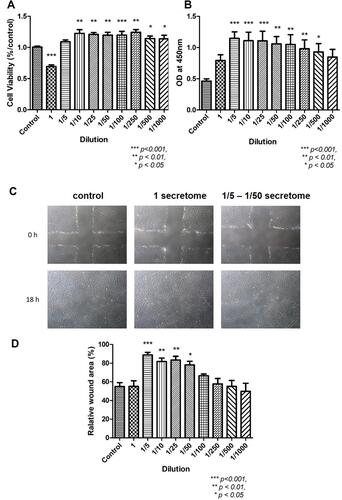
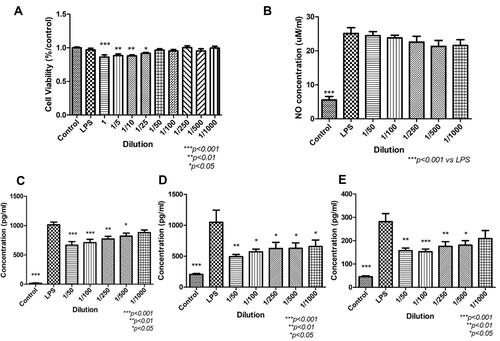
Figure 6 The cell viability, NO assay and ELISA of RAW 264.7 (macrophages) after treated with secretome. (A) The results of MTT indicated that high concentration (1–1/25) of secretome suppressed the metabolism of macrophages (1, ***p < 0.001; 1/5, **p < 0.01; 1/10, **p < 0.01; 1/25, *p < 0.05 vs control). (B) LPS-induced NO assay. The NO level was significantly increased after adding LPS into the media (***p < 0.001). After treated with secretome, no significant reduction was observed. (C-E) ELISA result of pro-inflammatory cytokines IL-6, MCP-1 and TNF-α. After induced by LPS, the level of pro-inflammatory cytokines was increased significantly (***p < 0.001). After treated with secretome in low concentration, the expressions were down-regulated. IL6: 1/50 – 1/100, ***p < 0.001; 1/250, **p < 0.01; 1/500, *p < 0.05, no significant difference was shown after treated with 1000x secretome. MCP-1: 1/50, **p < 0.01; 1/100 – 1/1000, *p < 0.05. TNF-α: 1/50, **p < 0.01; 1/100, ***p < 0.001; 1/250, **p < 0.01; 1/500, *p < 0.05, no remarkable difference in the supernatant treated with 1/1000 secretome.