
Figures & data
Table 1 Personal, Clinical and Pathological Data of the Studied Subjects
Figure 1 Mild positive membrano-cytoplasmic expression of TROP2 in epidermis of; (A) normal control and (B) BCC peri-lesional tissue. Moderate positive cytoplasmic expression of TROP2 in epidermis of; (C) BCC and (D) SCC (Immunoperoxidase x400 for all).
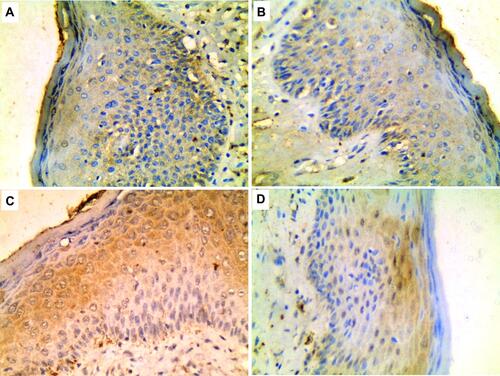
Figure 2 Tumor islands of BCC showing; (A) negative, (B) mild positive, (C) moderate positive and (D) strong positive TROP2 expression (Immunoperoxidase x200 for A and C; x400 for B and D).
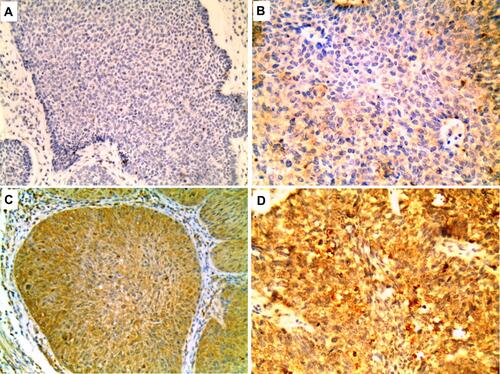
Figure 3 Tumor islands of SCC showing; (A) negative TROP2 expression in poorly differentiated case, (B) mild, (C) moderate and (D) strong TROP2 positivity in well differentiated cases (Immunoperoxidase x200 for A, C and D; x400 for B).
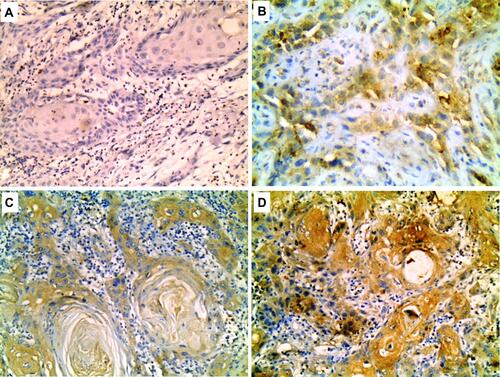
Table 2 Comparison Between the Studied Groups (Control, BCC and SCC) Regarding TROP2 Expression and H Score
Table 3 Relationship Between Controls, BCC Peri-Lesions and Lesions (Epidermis and Tumor Islands) Regarding TROP2 H Score
Table 4 Relationship Between Controls, SCC Peri-Lesions and Lesions (Epidermis and Tumor Islands) Regarding TROP2 H Score