Figures & data
Table 1 Age Distribution of Skin Disorders
Table 2 Comparison of Pruritus Between Males and Females
Figure 1 Prevalence and intensity of pruritus. (A) The prevalence of pruritus in common skin disorders. Chi-square test was used to analyze significance of differences in prevalence among skin disorders (XCitation2=370.0, p<0.0001). (B) VAS of pruritus. Data are expressed as mean±SEM. One-way ANOVA analysis was used to determine the significance of variation in VAS among skin disorders, p<0.0001.
Abbreviation: GC, Glucocorticoids.
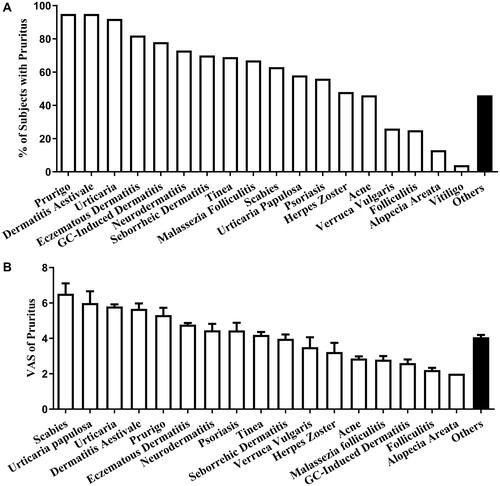
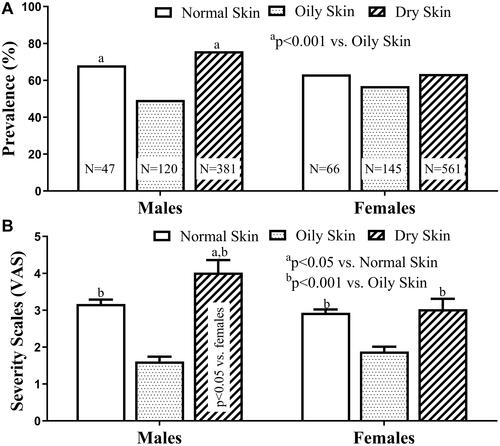
Figure 2 Association of skin type with prevalence and intensity of pruritus. (A) Prevalence of pruritus in different types of skin. (B) Association of VAS of pruritus with skin type. way ANOVA analysis was used to determine the significance of variation in VAS among skin types. Data are expressed as mean±SEM. Significances between males and females were determined using unpaired Student’s t-test.