Figures & data
Figure 1 Hyaluronidase-mediated degradation of subcutaneously implanted HA filler. Hairless mice implanted subcutaneously with 0.1 mL NDL. Top and bottom panels show NDL with 4- and 91-day filler residence time, respectively, before (A) and 1 h after hyaluronidase injection (B). Arrows mark the implantation sites showing the surface projection of the HA filler bolus.
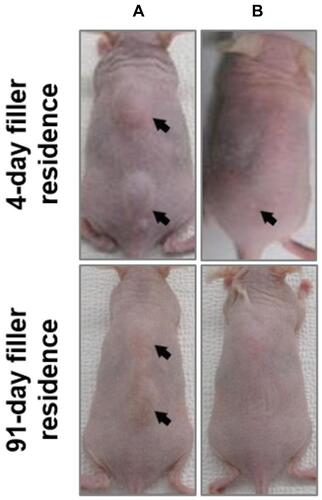
Figure 2 Time course for hyaluronidase-mediated degradation of HA dermal filler implants in hairless mice. Filler volume reduction of subcutaneously implanted HA fillers having 4-day (A) and 91-day (B) filler residence times and injected with 30 IU or 60 IU hyaluronidase (HYAL) per 0.1-mL HA filler based on surface projection measurements over a 72-h period. Data points with error bars represent mean ± SD. Asterisks *Indicate significant reduction (p < 0.05) in filler volumes between pre- and post-hyaluronidase injection.
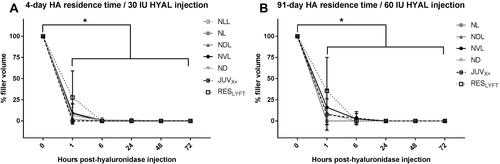
Table 1 Histological Examination to Assess Local Irritation at the Filler Implantation Sites Two Weeks After Hyaluronidase Injection
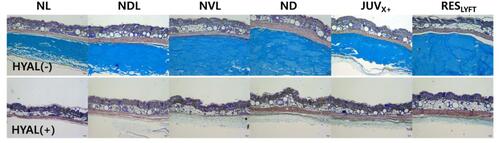
Figure 3 Cross section of sites with subcutaneously implanted HA dermal fillers (4-day filler residence time) before and two weeks after injection with 30 IU hyaluronidase (HYAL) per 0.1-mL HA filler volume. Alcian blue-stained areas show the HA filler layer before HYAL injection (top) and 2 weeks after treatment (bottom).
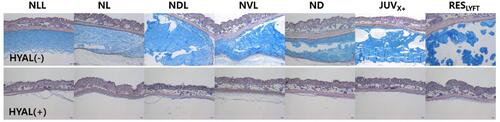
Figure 4 Cross section of sites with subcutaneously implanted HA dermal fillers (91-day filler residence time) before and two weeks after injection with 60 IU hyaluronidase (HYAL) per 0.1-mL HA filler volume. Alcian blue-stained areas show the HA filler layer before HYAL injection (top) and two weeks after treatment (bottom).