Figures & data
Table 1 A Summary of Investigations Reporting Inflammation and/or Fibrosis in AGA Biopsies
Figure 1 A photograph of a male vertex in the early stages of AGA. Zones represent potential biopsy locations separated by approximately 1 mm. Zone A features relatively high hair counts, low HDD, and terminal hair follicles skewed toward earlier cycles of HFM. Zone B features relatively low hair counts, high HDD, and terminal hair follicles skewed toward later cycles of HFM.
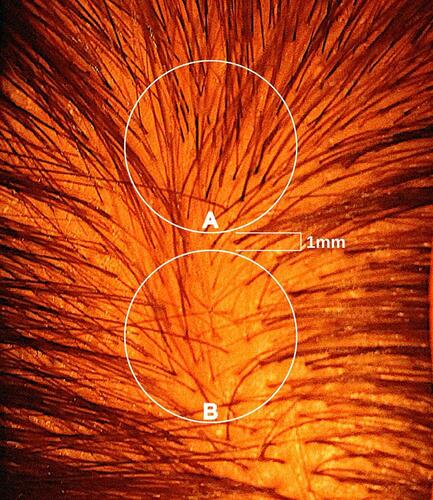
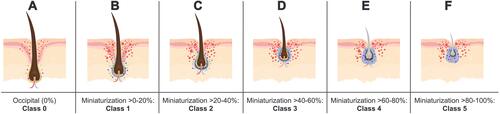
Figure 2 A proposed classification system to quantify relative HFM within the same subject. (A) Class 0 represents full-thickness hairs unaffected by AGA. (B–F) Classes 1–5 represent AGA-affected hairs benchmarked to Class 0, with miniaturization segmented by 20% increments per class.
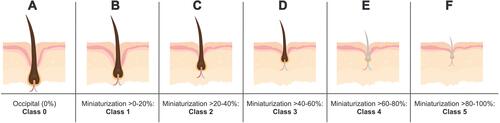
Figure 3 A hypothetical model showing a dynamic relationship between AGA and the presence of inflammation, fibrosis, and prostaglandin activity based on relative HFM. Inflammation is denoted by red markings; PGE2 synthase is denoted by green markings; PGD2 and PGJ2 are denoted by purple markings; fibrosis is denoted by blue perifollicular shading. (A) Class 0 hair follicles unaffected by AGA show no fibrosis and relatively low levels of inflammation, PGE2 synthase, PGD2, and PGJ2. (B and C): Class 1–2 hair follicles in the early stages of HFM show relatively low levels of fibrosis but increased inflammation, PGE2 synthase, PGD2, and PGJ2. (D–F) Class 3–5 hair follicles in the mid- to late-stages of HFM show increasing levels of fibrosis, decreased activity of PGE2 synthase, and sustained levels of PGD2 and PGJ2.