Figures & data
Table 1 The Frequency Distribution of Gender of the Research Subjects
Table 2 Age Distribution of the Research Subjects
Table 3 Distribution of SCORAD of the Research Subjects
Table 4 Severity of Atopic Dermatitis (SCORAD Category)
Table 5 Distribution of Substance P Levels in the Subjects
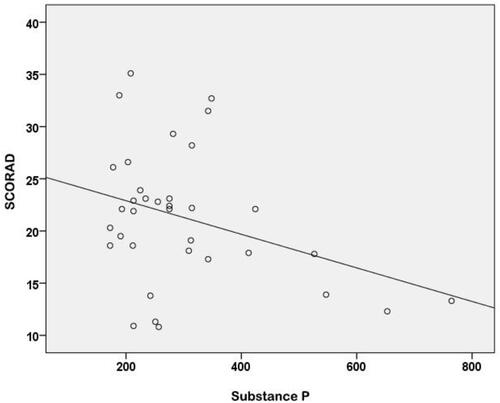
Table 6 Relationship Between Substance P Levels and Degree of AD Severity
Figure 1 Boxplot Graph of the Relationship Between Substance P Levels and Degree of AD Severity.
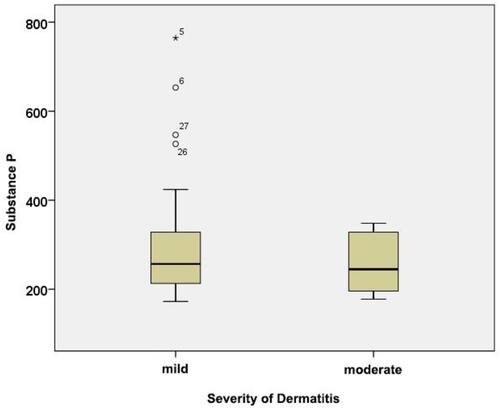
Table 7 Relationship Between Substance P Levels and SCORAD Value
Figure 2 Scatterplot Graph of the Correlation Between Substance P Levels and SCORAD Value.