Figures & data
Table 1 Sequences of the Primers for RT-qPCR
Figure 1 Skin damage by UV irradiation. (A–C) At 72 hr after 1 minimal erythemal dose (MED) irradiation of UVB, epidermal exfoliation could be found on the dorsum of C57BL6/J mice and clearly shown by dermoscopy (60x). During anagen, the dorsum of mice was black and the exfoliation of epidermis was more serious in the UVB group in the 4th week. There were heavy wrinkles on the dorsum of mice, and the photoaging skin was tanned and coarse by the 8th week. (D–F) Erythema was the striking feature of skin on the dorsum of mice in the UVA group. After 4 weeks’ irradiation, pigmentation formed on the back of mice. In addition, there were more grey hairs in the experimental region of the UVA group in the 8th week (P<0.01).
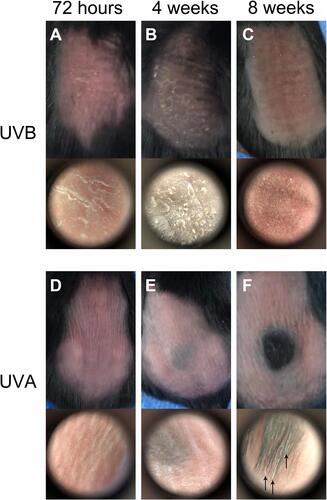
Figure 2 H&E and Masson’s staining (4x). Skin changes in histology. There was no statistical difference in epidermis between the control group and the UVA group (A, D, C and F). In the UVB group, the epidermis was significantly increased (B and E, ↓). There were large amounts of exfoliated epidermis in the UVB group (E, ←), and it was easy to see the hyperplastic sebaceous glands (E, ←). In the UV irradiation group, the collagen in dermis was disordered and the degradation was increased (E and F, ▲).
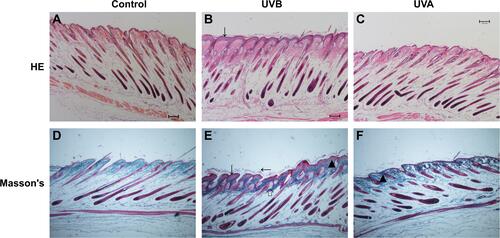
Figure 3 (A) Compared with the control group, the anagen and telogen phases of hair follicles were statistically prolonged in mice in the UVB group, and there was no significant difference in the UVA group. (B) There were more grey hairs in the UVA group. However, in the UVB group, there were fewer grey hairs compared with the control group. (C) The diameter of hair follicles in both the UVB group and the UVA group was significantly less than in the control group. (D) The depth of hair root was significantly decreased in the UVB and in the UVA groups. (E) Compared with the control group, the thickness of epidermis was significantly increased in the UVB group. (*P<0.05, **P<0.01).
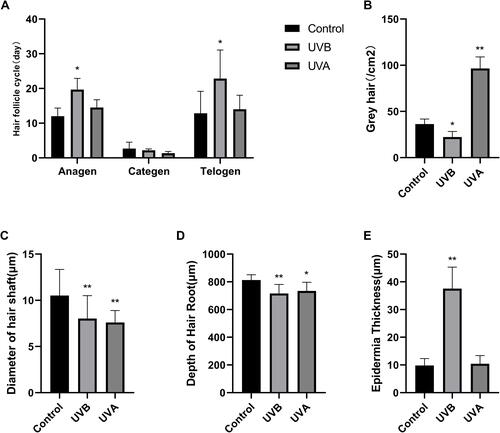
Figure 4 Immunohistochemistry (IHC) for proteins in the Wnt signaling pathway. (A) During anagen, the Wnt signaling pathway-related proteins, such as Wnt10b, β-catenin, and LEF1 were highly expressed in the IRS of hair follicles. (B) The expression of Wnt10b in hair follicles of the UV group was higher than in the control group. (C) The expression of β-catenin in hair follicles of the UVB group was higher than the control group, but there was no statistical difference between the UVA group and the control group. (D) The expression of LEF1 in hair follicles of the UVB group was significantly increased compared to the control group, and the protein in hair follicles of the UVA group was also higher than in the control group. (*P<0.05, **P<0.01).
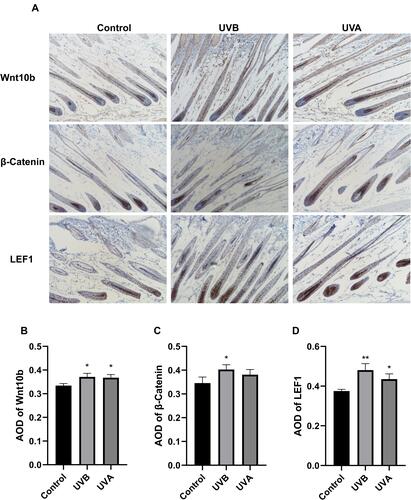
Figure 5 Relative protein expression by Western blot. (A and B) Compared with the control group, relative protein expression of Wnt10b was increased in both the UVB and the UVA groups. (A and C) The expression of β-catenin was also higher in both the UVB and the UVA groups as compared to the control group. (A and D) LEF1 expression was higher in the UVB and UVA groups than in the control group. (A and E) Western blot showed that UV irradiation up-regulated the expression of Tyr. (*P<0.05, **P<0.01).
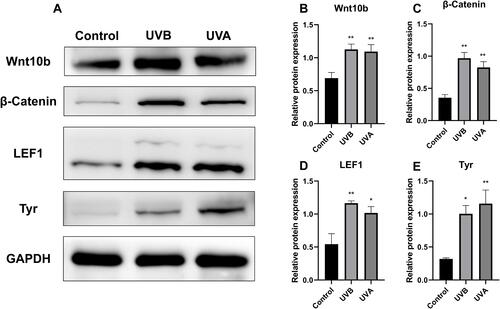
Figure 6 (A) UBV up-regulated the expression of Wnt10b. (B) Both UVB and UVA could up-regulate the expression of β-catenin, and the expression was especially higher in the UVB group. (C) The expression of LEF1 could be up-regulated by UV irradiation, especially UVB. (D) C-Myc, the downstream gene of the Wnt signaling pathway, was significantly up-regulated by UVB. The expression of c-Myc in the UVA group was statistically higher than in the control group. (E) UVB up-regulated the expression of CCND1. (F) UVB up-regulated the expression of Fos. (*P<0.05, **P<0.01).
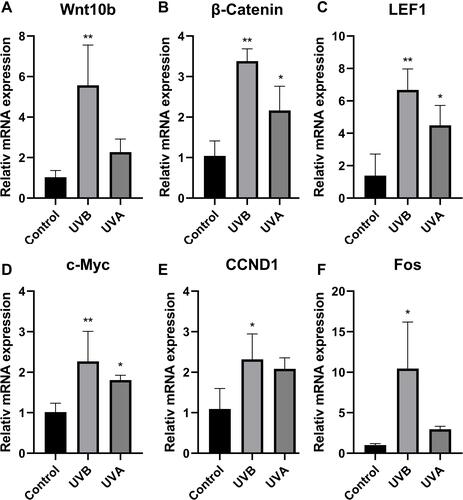
Figure 7 Hair follicle stem cells (HFSCs) and transit-amplifying (TA) cells in the three groups. Red fluorescence was chosen to label Sox9-positive cells which were HFSCs; the Sox9-positive cells were located in outer root sheath (ORS) of hair follicles. Ki67-positive cells labelled by green fluorescence were located in the hair bulbs. Merged fluorescence images showed that there were decreases of HFSCs and TA cells in the UVA group.
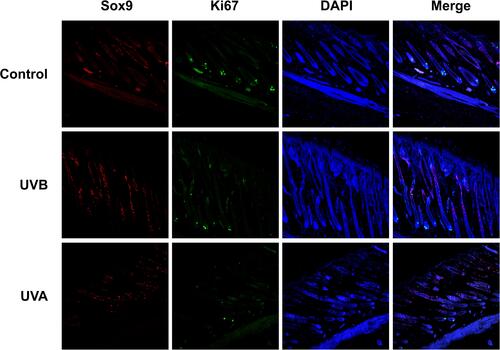
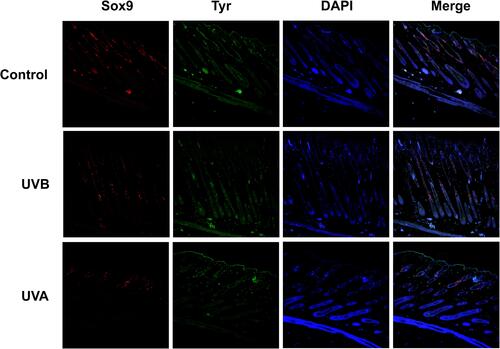
Figure 8 Red fluorescence was labelled for Sox9 as a marker for HFSCs. Tyr-positive cells labelled by green fluorescence were located in the hair bulbs and epidermis. HFSCs and melanocytes were decreased as shown by the merged images in the UVA group. There was an increase of Tyr-positive cells in the epidermis of the UVA group.