Figures & data
Figure 1 Flowchart of study design. Research design for the evaluation of erythema and hyperpigmentation in localized scleroderma lesions.
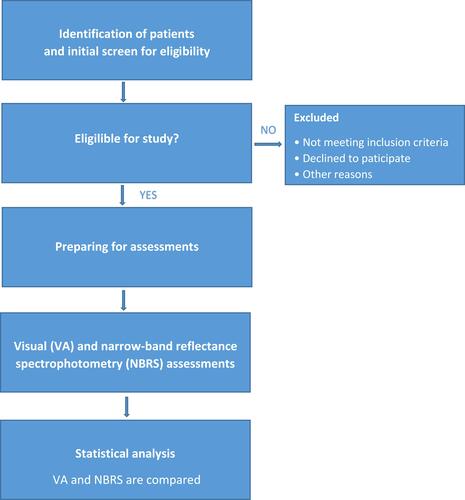
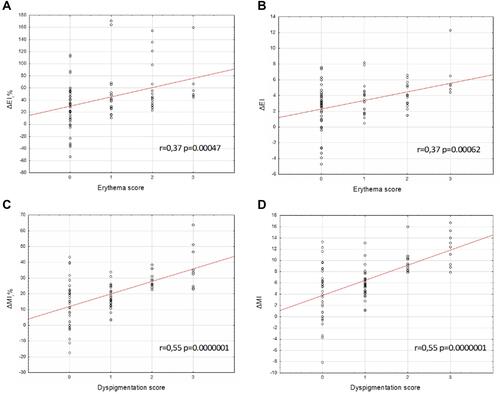
Figure 2 Correlations between spectrophotometric measurements and visual assessments of (A and B) erythema and (C and D) hyperpigmentation in localized scleroderma lesions.
Abbreviations: EI, erythema index; ΔEI, EIlesion- EInormal; ΔEIr%, relative percentage difference in the erythema index; MI, melanin index; ΔMI, (MIlesion- MInormal); ΔMIr%, relative percentage difference in the melanin index.