Figures & data
Figure 1 (A) The mechanism of photoacoustic microscopy, (B and C) the system used for in vivo photoacoustic imaging of mouse limb.
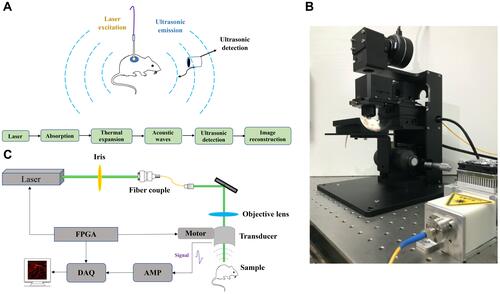
Table 1 The score of tissue lesions
Figure 2 (A) Avulsed hindlimb flap following a proximal circumferential incision. (B–D) The digital and PAM imaging of region of interest in mouse limb.
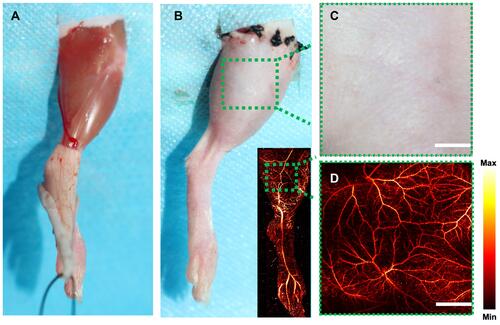
Figure 3 (A and B) H&E staining in avulsed hindlimb flap group and sham group. (C) The ulcer scars in two groups and the results show that the ulcer scars in avulsed hindlimb flap (necrosis) group were significantly higher than sham group. ****p < 0.0001.
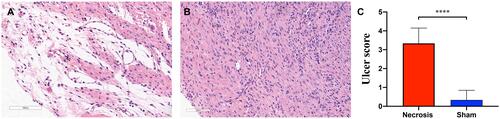
Figure 4 Clinical outcome at POD 7 and PAM imaging at several time points in region of interest between avulsed hindlimb flap group and sham group.
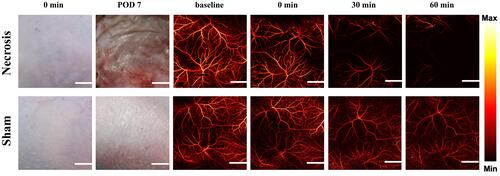
Figure 5 Quantitative analysis of PA intensity in ROIs detected by PAM between two groups. ****p < 0.0001.
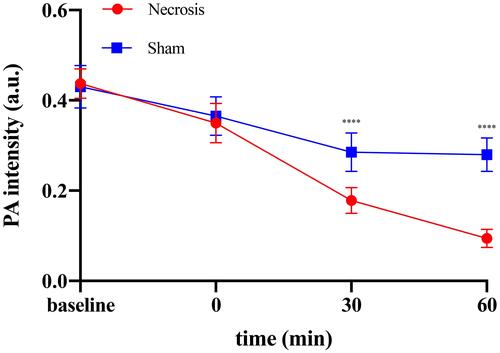
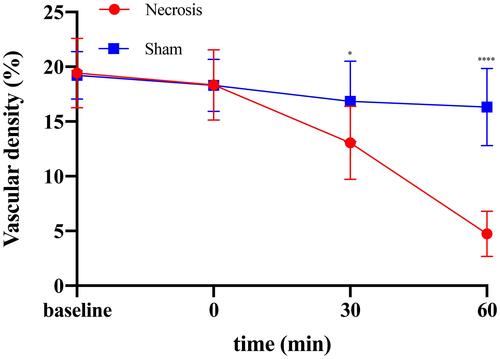
Figure 6 Quantitative analysis of vascular density in ROIs detected by PAM between two groups. *p < 0.05, ****p < 0.0001.