Figures & data
Table 1 Expression of Cathepsin K and Progerin Protein/mRNA After Single High Dose Irradiation
Table 2 Expression of Cathepsin K and Progerin Protein/mRNA After Repeated Low Dose Irradiation vs High Dose Irradiation
Figure 1 Alterations in progerin (A) and cathepsin K (B) mRNA relative expression (-ΔCt) after exposure to different wavelengths of UVR. Asterisks above columns indicate level of statistical significance (* p<0.05, **p<0.001). Data presented as means (horizontal black line within box) with standard deviation (boxes).
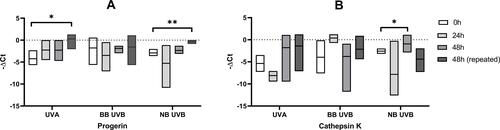
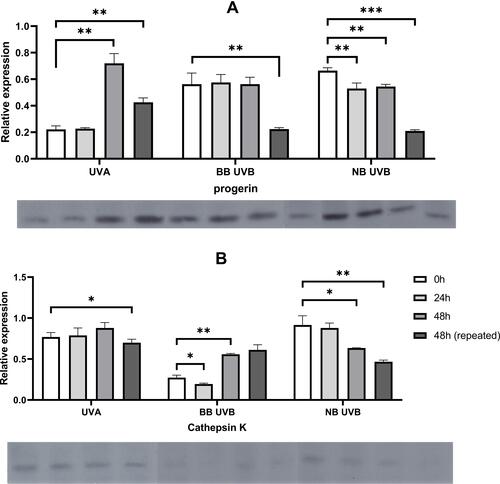
Figure 2 Alterations in progerin (A) and cathepsin K (B) protein expression after exposure to different wavelengths of UVR. Asterisks above columns indicate level of statistical significance (* p<0.05, **p<0.001, ***p<0.0001). Data presented as means (boxes) with standard deviation (whiskers). Corresponding Western blot bands are shown below each graph.