Figures & data
Figure 1 Flow diagram of the study.
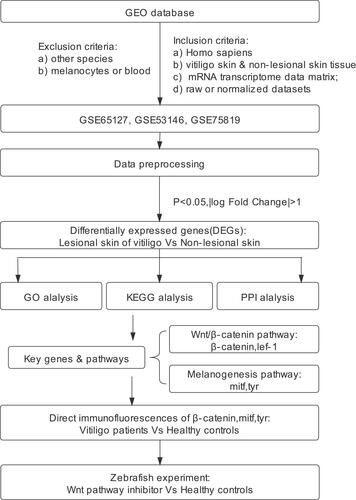
Figure 2 Batch effects elimination and Venn plot. (A) Batch effects elimination of datasets GSE65127, GSE53146 and GSE75819. (B) Venn plot revealed the number of overlapping genes among the three datasets.
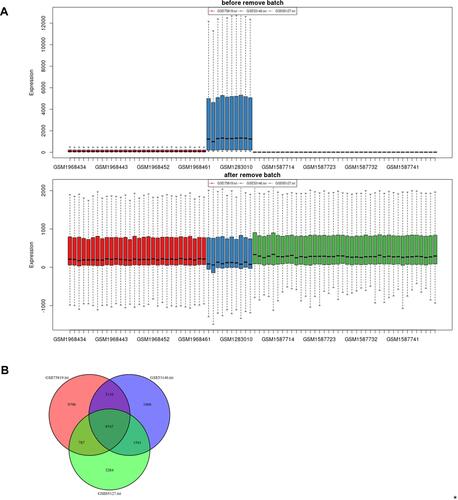
Figure 3 Differentially expressed genes (DEGs) between the vitiligo lesional skin group and non-lesional skin group among three datasets. (A) Volcano plot of DEGs for GSE75819, GSE53146 and GSE65127 datasets. The red and blue spots represented relative upregulated and downregulated DEGs based on |log fold change| >1 and adjusted P-value <0.05. The gray dots represented the genes with no statistically significant differences. The names of the top 10 DEGs are shown in the volcano plot. (B) Cluster heat map of the top 100 DEGs sorted by |log fold change| value. The color in heat maps from green to red shows the progression from low to high levels of gene expression.
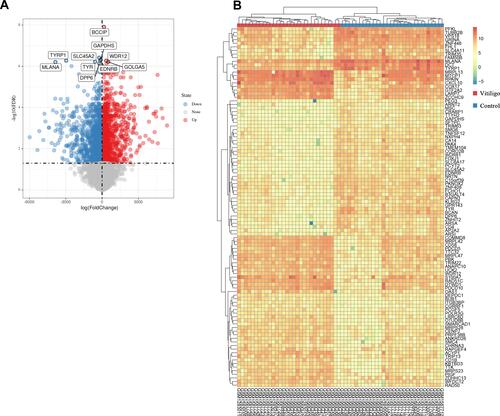
Figure 4 GO and KEGG enrichment results of the vitiligo datasets. (A) For upregulated DEGs, the top 30 enriched GO terms sorted by adjusted P-value. (B) For downregulated DEGs, the top 30 enriched GO terms sorted by adjusted P-value. (C) For upregulated DEGs, the top 10 enriched KEGG pathway sorted by gene number. (D) Pathway–gene interaction network of the top 10 enriched KEGG pathways and upregulated DEGs. (E) For downregulated DEGs, the top 10 enriched KEGG pathways sorted by gene number. (F) Pathway–gene interaction network of the top 10 enriched KEGG pathways and downregulated DEGs.
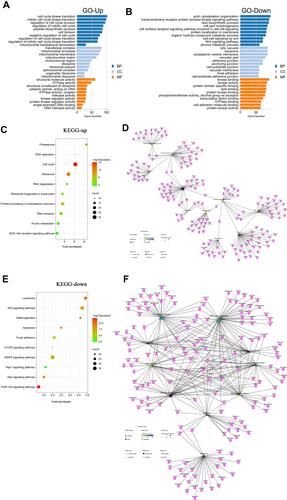
Table 1 Top 3 KEGG and GO Enrichment Terms Associated with the Hub Modules of Upregulated DEGs
Table 2 Top 3 KEGG and GO Enrichment Terms Associated with the Hub Modules of Downregulated DEGs
Figure 5 Melanocytes deficiency in vitiligo lesions; Impaired β-catenin expression in vitiligo lesions. (A) Representative images of the melanocytes in healthy skin samples (n = 6) and vitiligo lesions (n = 6) detected by immunofluorescence. Melanocytes were stained with antibody to TYR(green) and MITF(red). Nuclei were counterstained with DAPI(blue). Scale bar = 50μm; (B) Representative images of the expression of β-catenin (green) in healthy skin (n = 6) and vitiligo lesions (n = 6) detected using immunofluorescence. Melanocytes were stained with antibody to MITF(red). Nuclei were counterstained with DAPI(blue). Scale bar = 50 μm; (C) Each bar graph represents an average number of melanocytes per view field (20x) in one group (control, Mean±SD=10.17±2.049; vitiligo, Mean±SD=0.19±0.10). For each sample, five fields of view were randomly selected for counting. (D) Signal intensity of β-catenin was quantified by ImageJ software. Each bar graph represents the Mean±SD value of one group (control, Mean±SD=105.2±6.50 vitiligo, Mean±SD=58.37±9.64). For each sample, five fields of view were randomly selected for counting. P-values were calculated by unpaired t-test. (**P < 0.01,***P<0.001).
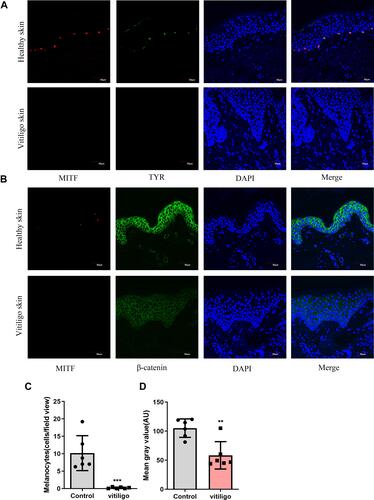
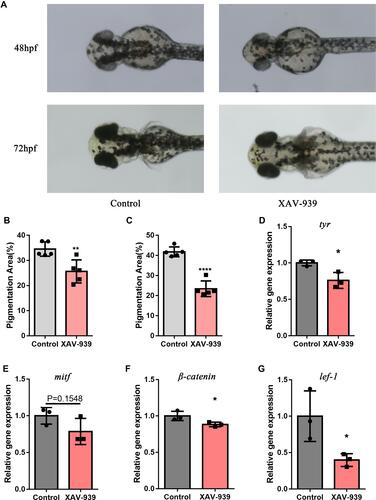
Figure 6 Wnt/β-catenin pathway inhibitor reduced melanogenesis and gene expression of β-catenin, lef1, mitf and tyr in zebrafish. (A) Melanin granules in the heads of zebrafish at 48hpf and 72hpf. (B) Using ImageJ, the area of melanin granules as a percentage of the head area was measured at 48hpf. Each bar graph represents the Mean±SD value of one group (control, Mean±SD=34.53±1.27;XAV-939, Mean±SD=25.63±2.05). (C) The area of melanin granules as a percentage of the head area was measured at 72hpf. Each bar graph represents the Mean±SD value of one group (control, Mean±SD=41.76±1.10;XAV-939, Mean±SD=23.41±1.75). (D–G) The relative expression of four genes were confirmed with q-PCR. The fold change values of each gene were: tyr(control, Mean±SD=1.00± 0.02;XAV-939, Mean±SD=0.76±0.06), mitf(control, Mean±SD=1.00±0.07;XAV-939, Mean±SD=0.79±0.10), β-catenin(control, Mean±SD=1.00± 0.04;XAV-939, Mean±SD=0.88± 0.02) and lef1(control, Mean±SD=1.00±0.20;XAV-939, Mean±SD=0.40±0.05). Pigmentation area (%) was defined as the area of melanin granules as a percentage of area of the head of zebrafish; hpf, hour post fertilization; q-PCR, Quantitative polymerase chain reaction. (*P<0.05,**P<0.01,****P<0.0001).