
Figures & data
Figure 1 Study design (mITT population). The hair growth measures (TAHC, SSA, and IGA) were assessed at weeks 8, 16, 24, and 32 (or early study exit); adverse events were assessed at every study visit. Prespecified study visits are marked by blue vertical lines. aA once-daily finasteride 1-mg arm was initially included in the study design but was removed to increase enrollment in the other arms.
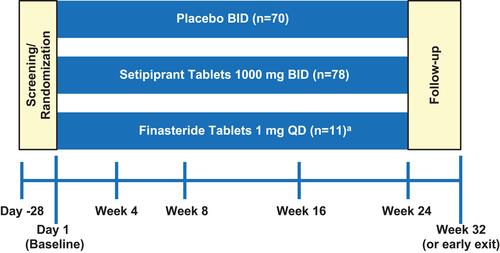
Table 1 Subject Disposition
Table 2 Demographics and Baseline Characteristics (mITT Population)
Table 3 Efficacy Endpoints at Week 24: LS Mean Change from Baseline and LS Mean Difference Between Setipiprant and Placebo Using ANCOVA (mITT Population)
Figure 2 Target area hair count mean change from baseline by time point (mITT population). Data shown are within a 1-cm2 circular area on the left side of the anterior leading edge of the vertex thinning area of the scalp. aPrimary time point.
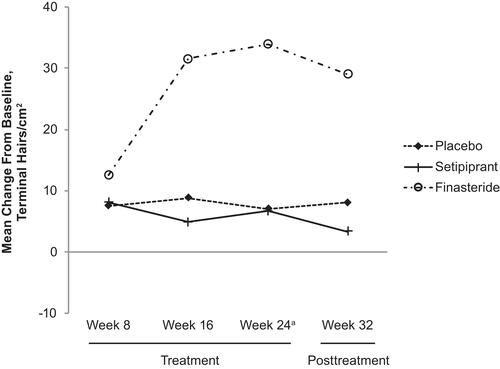
Figure 3 Subject Self-Assessment (SSA) of hair growth mean change from baseline by time point (mITT population). aPrimary time point.
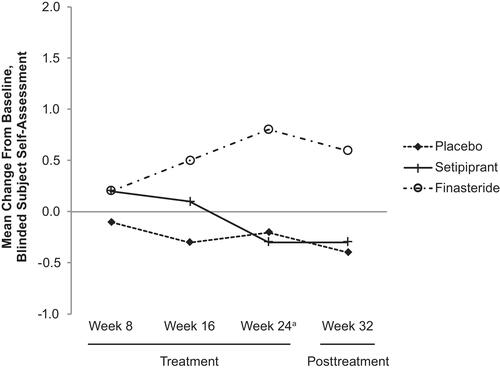
Figure 4 Investigator Global Assessment (IGA) of hair growth mean change from baseline by time point (mITT population). aPrimary time point.
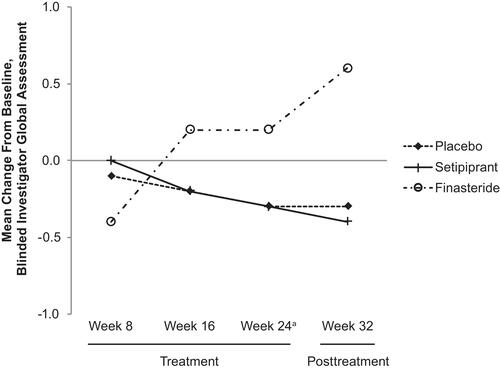
Figure 5 Representative pre- (baseline) and posttreatment (week 24) photographs of subjects with androgenetic alopecia treated twice daily with setipiprant tablets 1000 mg (2×500 mg for a daily total dose of 2000 mg) for 24 weeks. Photographs show the vertex and frontal/superior views of a 41-year-old subject (A and B), a 32-year-old subject (C and D), a 39-year-old subject (E and F), and a 37-year-old subject (G and H).
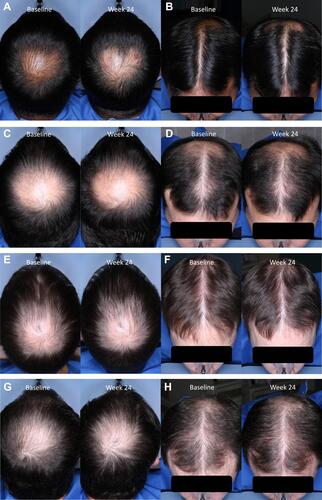
Table 4 Adverse Events (Safety Population)
Table 5 PCS Postbaseline Liver Function Tests in Subjects with Non-PCS Baseline Values (Safety Population)