
Figures & data
Table 1 Descriptive Statistics for Daily Outpatient Visits, Concentrations of Air Pollutants, and Weather Conditions
Figure 1 Original plots of outpatients, AP, and meteorological factors over time. (A and B) shows the daily levels of PM10, SO2, and NO2, and the daily outpatient numbers for post-adolescent acne, respectively. (C) shows the monthly average temperature and relative humidity during the study period.
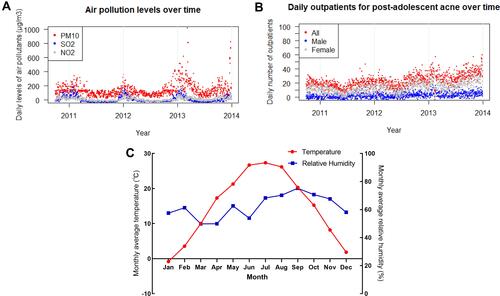
Figure 2 Percent change (mean and 95% CI) of daily outpatient visits for post-adolescent acne associated with per 10 μg/m3 increase of pollutant concentrations at different lag days in different sex models.
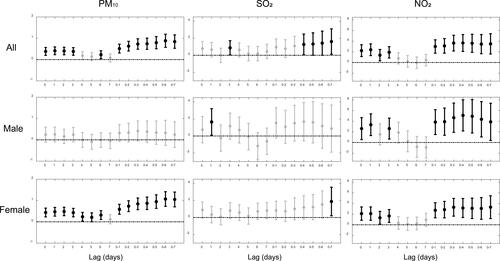
Figure 3 Exposure–response curves for air pollutants and post-adolescent acne. The X-axis is the pollutants’ concentrations (μg/m3) at lag 0–7 day. The Y-axis is the log-relative risk of outpatient visits for post-adolescent acne with per 10 μg/m3 increase in pollutant concentration. The solid lines show the estimated mean percentages of change in daily outpatient visits for post-adolescent acne. The dotted lines represent the point-wise standard errors, which means 95% confidence intervals.
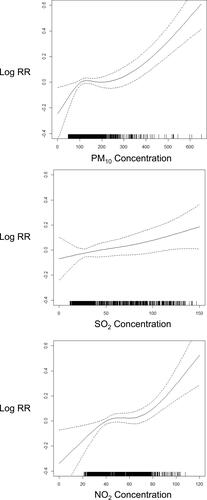
Table 2 Percent Change (Mean and 95% CI) of Daily Outpatient Visits for Post-Adolescent Acne Associated with per 10 μg/m3 Increase of Pollutant Concentration at Lag 0–7 Day in Two-Pollutant Models