
Figures & data
Table 1 General Characteristic Comparison Between the Two Groups (x ± s), (n), and [n (%)]
Table 2 Therapeutic Effect Comparison Between the Two Groups
Figure 1 A female patient in control group: before treatment.
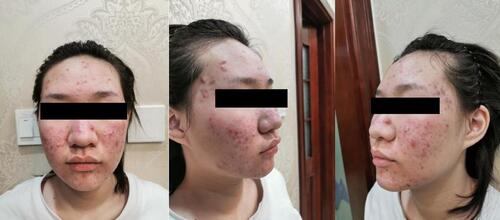
Figure 2 A female patient in control group: follow up 6 months after treatment.
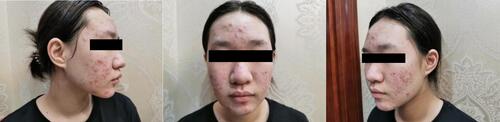
Figure 3 A female patient aged 20 of the observed group. Frontal and bilateral clinical photos of the face before treatment.
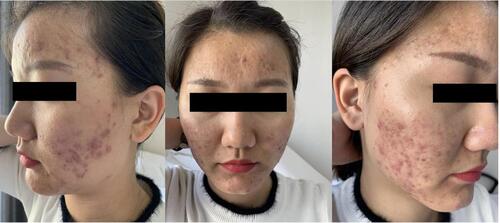
Figure 4 A female patient aged 20 of the observed group. Frontal and bilateral clinical photos of the face 6 months after treatment.
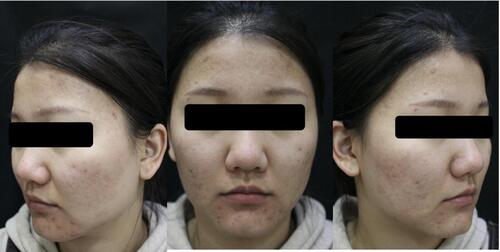
Table 3 Adverse Reaction Incidence Comparison Between the Two Groups Three Days After Treatment
Table 4 Postoperative VAS Comparison Between the Two Groups
Table 5 Patient Satisfaction Comparison Between the Two Groups